Follow LVIS
External Links
- 61A: Geodesy and Geophysics Laboratory
- Operation IceBridge
- ABoVE
- NSIDC
- GEDI
- GRACE
- University of Maryland
Recent News
LVIS featured on #ScienceInSeconds
28 Jul 2021
Dr. Michelle Hofton was interviewed for NASA Associate Administrator Dr. Thomas Zurbuchen's Twitter update during the 2021 GEDI Calibration/Validation campaign!
Greenland data available at NSIDC
14 Jun 2018
LVIS Level 1B and 2 data products from Operation IceBridge Greenland 2017 are now available at NSIDC. Links are now available here!
ABoVE data available at NSIDC
9 May 2018
LVIS Level 1B and 2 data products from ABoVE 2017 are now available at NSIDC, and the IceBridge 2017 data products have been sent out. Take a look here!
ABoVE data sent to NSIDC
8 Mar 2018
LVIS data from ABoVE 2017 has been sent to NSIDC. As soon as the data is available, links will be posted here!
IceBridge 2013, Greenland
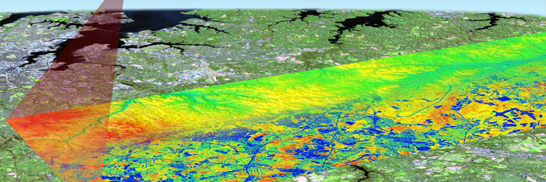
In September 2013, the NASA LVIS was deployed to Greenland for NASA's Operation IceBridge Summer Campaign. 9 flights were flown over sea ice and the icesheet, repeating flight lines covered by the Spring Campaign using the P3. Two LVIS instruments were mounted in the airplane, side by side, providing almost a 2x widened swath of data: Both sensors collected data within a 200mrad swath with a 50mrad overlap zone at nadir. Data from both sensors are available in Level1B and Level2 formats. The Level1b data files contain the geolocated laser waveform data for each laser footprint. The Level2 data files contain elevations of reflecting surfaces, derived from the Level1b data.
Level 2 files are much smaller and more manageable. For those users not familiar with waveform lidar data, we recommend that you start with the Level2 files before moving to the Level1b files (e.g., for context or to apply different algorithms).
The Level1B data are in HDF5 and the Level2 data are in ascii.
LVIS Mission Information
|
Resources | ||||||||||||||||||||||||||||||||||||
Data Products
| LVIS and LVIS-GH Data Products | Format | Download Location |
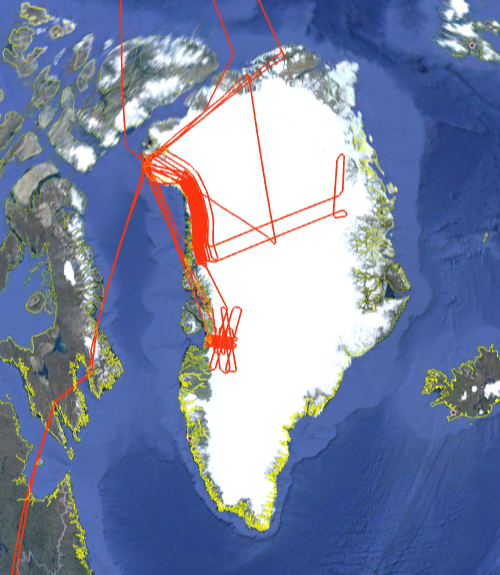
| Flight Trajectories | KMZ | This page |
| LVIS L1A Camera Imagery | JPG* | Coming Soon |
| LVIS L1B Geolocated Waveforms | HDF, LDS 1.04 | NSIDC1, NASA EarthData |
| LVIS-GH L1B Geolocated Waveforms | HDF, LDS 1.04 | NSIDC1, NASA EarthData |
| LVIS L2 Elevation and Height Products | ASCII TXT, LDS 1.04 | NSIDC1, NASA EarthData |
| LVIS-GH L2 Elevation and Height Products | ASCII TXT, LDS 1.04 | NSIDC1, NASA EarthData |
*Image position and attitude embedded in exif data.
1 At NSIDC, search for date ranges 01 Oct 2013 through 30 Nov 2013
Known Data Set Issues
The lower energy sections of the swaths were removed from the final data sets on some days. This was due to the poor quality installed in the nadir port in the aircraft which caused lensing and burning within the plexiglass. The window was rotated mid-deployment to minimize the affected area.
Localized lower energy sections of the swath were not stable and removed from final data sets where possible. This was caused by the airplane leaking fluid on some sections of some days of flights.
| Display | MJD | Date | Region / Remarks | Platform | Flight Trajectory |
|---|---|---|---|---|---|
| 56595 | 30 Oct 2013 | Transit to Thule | NASA C-130 | [JPEG] [PDF] [kmz] [shp] | |
| 56596 | 31 Oct 2013 | South Basin Transect | NASA C-130 | [JPEG] [PDF] [kmz] [shp] | |
| 56597 | 01 Nov 2013 | North West Grid 01 | NASA C-130 | [JPEG] [PDF] [kmz] [shp] | |
| 56600 | 04 Nov 2013 | North West Grid 02 | NASA C-130 | [JPEG] [PDF] [kmz] [shp] | |
| 56601 | 05 Nov 2013 | Cryosat Sea Ice | NASA C-130 | [JPEG] [PDF] [kmz] [shp] | |
| 56602 | 06 Nov 2013 | North Central Gap | NASA C-130 | [JPEG] [PDF] [kmz] [shp] | |
| 56604 | 08 Nov 2013 | Jakobshavn ICESat Grid | NASA C-130 | [JPEG] [PDF] [kmz] [shp] | |
| 56605 | 09 Nov 2013 | Jakobshavn P-3 Grid | NASA C-130 | [JPEG] [PDF] [kmz] [shp] | |
| 56608 | 12 Nov 2013 | Cryosat Land Ice | NASA C-130 | [JPEG] [PDF] [kmz] [shp] | |
| 56610 | 14 Nov 2013 | North West Grid 03 | NASA C-130 | [JPEG] [PDF] [kmz] [shp] | |
| 56611 | 15 Nov 2013 | Transit to WFF | NASA C-130 | [JPEG] [PDF] [kmz] [shp] | |
| Fall 2013 | All Greenland 2013 Flights | NASA C-130 | [kmz] [shp] |