Click image to download a Hi-Res version. (~4 MB)

The NASA/GSFC LVIS sensor was used to collect data in the region of the Crane,
Evans, Green, Jorum and Hektoria Glaciers on the Antarctic Peninsula on November 5th, 2009.
The data collection was part of Operation IceBridge activities and was flown during a single
11 hour flight on the NASA DC-8 aircraft
at altitudes of ~35,000' and above.
The official footprint level data products can be downloaded from
NSIDC
under the IceBridge Data Section.
We have also generated some preliminary gridded data products to facilitate visualization of
these data. Data were gridded using a nearest neighbor algorithm at a spacing of 30m in a polar
stereographic projection (projection center 71S,0E) and the grids output in
NetCDF format (.nc)
and as an ascii x, y, elevation file.
The reference frame of the data is ITRF00. Earth Tide corrections have been applied.
Utilizing a rapid-PPP aircraft trajectory solution and preliminary instrument biases,
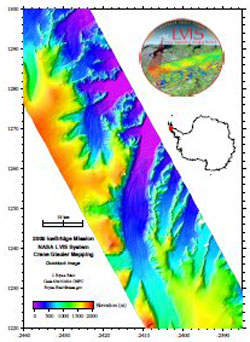
the LVIS team created this quicklook topographic image of the Crane Glacier just a few days after
collecting the data.
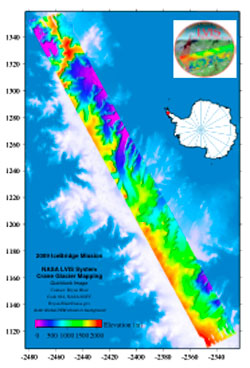
The entire mapped area is 16 x 160 miles (26 x 260 km), and this image shows the center ~1/3.
The total area is ~ 7,000 sq. km (roughly the size of the US state of Delaware) - this is the largest,
contiguous area we have ever mapped with LVIS, and the DC-8 allowed us to collect it in a single flight.
This image consists of 16 lines stitched together ("mowing the lawn") and the footprints were approximately
20 m in diameter. Some small processing artifacts are evident when you zoom in close, but these will go
away once we apply the final timing and angle calibrations.
Three files are provided in NetCDF and ASCII format, each refering to different reflecting
surfaces within each laser footprint. To Download files click on the file of interest below:
- "Low Surface" indicates that the mean elevation of the lowest reflecting surface.
- "High Surface" indicates that the mean elevation of the highest reflecting surface.
- "Centroid Surface" indicates the centroid of the returned waveform.
Click image to download a Hi-Res version (~14MB).

In simple, non-complex terrain such as the smooth interior of an ice sheet, the "low" and
"high" surfaces will be identical since the laser return waveform will only contain one
~gaussian mode. However, over more complex terrain, for example, crevassed or rocky surfaces
where multiple reflecting modes occur within the laser footprint, these two surfaces will
occur at different elevations and it is left to the end user to decide which will be the more
appropriate elevation product for their application. These 3 surface elevations are also in the official NSIDC LVIS level2
data products. All of these data products are derived from the official LVIS NSIDC Level1B data
product (the geolocated laser waveform).
A geotiff format file is also provided to which the EGM96 geoid offset has been applied to the
elevations. Files are:
Users should be aware that these gridded data will have degraded precision relative to
that of the actual individual footprint level data. Data collected during turns have been
removed from the release data due to slightly degraded accuracy - please contact us for
further information on the availability of these additional data. We have also filtered out
some data where the detector was slightly saturated although these data may be included in
future releases, once corrected.


