Follow LVIS
External Links
- 61A: Geodesy and Geophysics Laboratory
- Operation IceBridge
- ABoVE
- NSIDC
- GEDI
- GRACE
- University of Maryland
Recent News
LVIS featured on #ScienceInSeconds
28 Jul 2021
Dr. Michelle Hofton was interviewed for NASA Associate Administrator Dr. Thomas Zurbuchen's Twitter update during the 2021 GEDI Calibration/Validation campaign!
Greenland data available at NSIDC
14 Jun 2018
LVIS Level 1B and 2 data products from Operation IceBridge Greenland 2017 are now available at NSIDC. Links are now available here!
ABoVE data available at NSIDC
9 May 2018
LVIS Level 1B and 2 data products from ABoVE 2017 are now available at NSIDC, and the IceBridge 2017 data products have been sent out. Take a look here!
ABoVE data sent to NSIDC
8 Mar 2018
LVIS data from ABoVE 2017 has been sent to NSIDC. As soon as the data is available, links will be posted here!
-
Accuracy of biomass estimates from radar and lidar over temperate forests
Ahmed, R. AGU December 2011
A better understanding of ecosystem processes requires accurate estimates of forest biomass and structure on global scales. Recently, there have been demonstrations of the ability of remote sensing instruments, such as radar and lidar, for the estimation of forest parameters from spaceborne platforms in a consistent manner. These advances can be exploited for global forest biomass accounting and structure characterization, leading to a better understanding of the global carbon cycle. The popular techniques for estimation of forest parameters from radar instruments in particular, use backscatter intensity, interferometry and polarimetric interferometry. In this paper we analyze the accuracy of biomass estimates over temperate forests of the North-Eastern United States from lidar and radar backscatter. We adopt an empirical approach, relying on ground truth data collected during DESDynI field campaigns over the Harvard and Howland Forests in 2009 and remote sensing data from LVIS, the GSFC full-waveform lidar and NASA JPL's L-band UAVSAR. UAVSAR collected data over the Harvard and Howland Forests during a deployment in 2009 where it was flown in a repeat-pass configuration collecting several fully polarimetric scenes. In a concurrent deployment of the GSFC LVIS instrument, full waveform lidar data was collected over the same region. Diameter and species information from fifteen hectares at the Harvard Forest and twenty three hectares at the Howland forest was collected during the July 2009 DESDynI field campaigns as well. We assess the accuracy of biomass estimates based on diameter measurements by using a classic statistical approach to characterize the impact of the diameter-biomass allometry at both field sites. Using a lidar error model and estimates of error in field biomass, we attempt to characterize the error in biomass estimates from common full waveform lidar metrics from LVIS data over the Harvard and Howland forests. Similarly, using a radar backscatter error model and data from UAVSAR, we analyze the accuracy of the backscatter-biomass relationship and characterize the uncertainty in biomass estimates from radar in a non-linear regression setting with measurement error. A discussion will be provided on the implications of this analysis on the design and science outcomes of the proposed DESDynI mission. -
Modeling Effects of Vegetation and Topography on Subcanopy Solar Irradiance using Waveform Lidar
Anand, A.; Dubayah, R. H. M. A. AGU December 2011
opography and canopy structure significantly affect the spatial variability of subcanopy surface solar radiation but have not been widely incorporated in radiation balance estimates due to limited information on vertical canopy structures and requirements for intensive ground based data collection. In this particular research work, we discuss the development of a 3-D model by integrating these two factors. Medium footprint waveform Lidar data from Laser Vegetation Imaging Sensor (LVIS) collected in 2008 over Sierra National Forest, California is used as input for the model. The 3-D model is based on radiative transfer principles and ray tracing techniques to estimate subcanopy surface solar irradiance. Light transmittance value is estimated for each of the canopy voxels. Transmittance at various solar positions is then converted into irradiance given, direct and diffuse components of irradiance at top of the canopy. To accommodate the effects of topography, the rays are traced from the surface towards the sun and the lower limit of horizon is calculated using the surface DEM. The study is expected to increase knowledge on topographic and vegetation effects on sub-canopy surface solar radiation. The resulting solar radiation maps can be used to improve the outcome of many physical based and ecological models. -
Mapping Land, Vegetation, and Ice with Wide-swath, Full-waveform Laser Altimetry from High-altitude UAV Aircraft
Blair, B. AGU December 2011
While the majority of airborne lidar sensors are restricted to low-altitude operations due to sensor limitations, the Land, Vegetation, and Ice Sensor (LVIS - formerly the Laser Vegetation Imaging Sensor) has transitioned to the Global Hawk aircraft for operations at 20 km altitude. NASA's Earth Science Technology Office (ESTO) has assisted in procuring funding to transition the LVIS sensor into the Global Hawk aircraft and the sensor is readying for integration onto the aircraft based at NASA Dryden. The current LVIS sensor has operated with sub-decimeter accuracy from as high as 13 km altitude while fully mapping a > 2 km wide swath and the new instrument will maintain that level of accuracy while extending the swath coverage to 4 km. Both the transmitted waveform and the return echo waveform are sampled and recorded for post-processing for a wide range of Earth science applications, including ice sheet elevation and change mapping, sea ice coverage, natural hazards such as volcanoes, and forest mapping for biomass and habitat assessment. The LVIS data are distributed in a unique waveform vector format that is an accurate representation of the entire interaction of the laser pulse with the surface roughness, texture, slope, and any complex structure such as forest canopies or crevassed ice surfaces. End-user scientists can reinterpret the waveform using their own algorithms and still capture the full accuracy of the sensor data. Once LVIS is fully operational on the Global Hawk aircraft, it will collect data at a rate of 2,500 km^2 per hour and the Global Hawk has a flight duration of over 30 hours. The extraordinary range of the Global Hawk opens up the possibility of mapping remote areas such as Antarctica and Greenland. Performance expectations and examples of existing data will be shown as well as potential future flight plans. -
Spatial Uncertainty Analysis for LVIS and UAV-SAR Attribute Fusion
Chakravarty, S.; Franks, S. AGU December 2011
NASA's Land, Vegetation, and Ice Sensor or "LVIS", is a scanning laser altimeter instrument that is flown, on aircraft, to collect waveform data on surface topography and vegetation coverage(1). The collected waveform needs to be decorrelated to extarct surface characteristics.The challenge of waveform decorrelation is to be able to find unique representations of the waveform so that the complexities of the waveform signal are captured without being significantly affected by noise. Many spatio-temporal techniques have been used for echo extraction and decorrelation of the waveform. They include modeling and fitting of waveforms as a mixture of multiple Gaussians (Wagner et al.,2006). Other techniques of waveform fitting like non linear least square techniques using Levevnberg-Marquardt technique (Hofton et al 2000), Maximum Likelihood approach using the Estimation Maximization algorithm (pearson et al.,2005) and Reversible Jump Monte Carlo Markov Chain method (Chauve 2007). A common issue with most of the above methods is their increased theoretical and computational complexity which makes such processing expensive. A novel way to approach the problem of waveform characterization would be to convert the waveforms from time domain to time-frequency domain using wavelet transform and extract attributes there from. The UAV-SAR is reconfigurable polarimetric L-Band synthetic aperture radar (SAR) (2). The radar design is fully polarimetric with an 80 MHz bandwidth (2 m range resolution) and 16 km range swath. The polarimetric image is formed by implanting the red, green and blue channels of the color image with the mean backscatter of HH, HV/VH,VV polarizations respectively. The noise level of the SAR data is much lower than that typically found in a SAR image. This is because it has been multilook processed as well asdue to the medium resolution of the SAR image. A unique way to extract attribues from the false colored SAR would be to use color space transformation.Due to the medium to low resolution of the above sensors, fusion analysis on the extracted attributes is mostly plagued with uncertainties. In this study the extracted information from the two modalities are treated using spatial uncertainty analysis. Statistical-Set theoretic based analysis as well as simulation based approach using error propagation law are tried. The results of uncertainty analysis can be used as performance metric or feedback for the respective attribute extraction algorithms. (1) http://lvis.gsfc.nasa.gov/ (2) http://uavsar.jpl.nasa.gov/ -
Arctic sea ice freeboard from CryoSat-2: Validation using data from the first IceBridge underflight
Connor, L. N.; Laxon, S. W. M. D. C. R. A. C. R. F. S. F. R. AGU December 2011
Exact determination of thickness changes in Arctic sea ice is a primary goal of ESA's CryoSat-2 mission. Since its launch on April 8, 2010, CryoSat has collected data to map sea ice thickness and thereby monitor climate-driven ice thickness change. On April 20, 2010 just 12 days after CryoSat's launch - during NASA's IceBridge Spring 2010 campaign, the NASA DC-8 conducted a spatially and temporally coincident survey along some 670 km of a CryoSat ground-track in the northernmost Arctic Ocean. The DC-8 survey was flown out and back along the CryoSat ground-track. The DC-8 collected two laser altimetry datasets: (1) Laser Vegetation Imaging Sensor (LVIS) data, and (2) scanning laser Airborne Topographic Mapper (ATM) data. IceBridge also collected a number of other important data types including digital photography of sea ice, snow thickness radar, Ku-band radar altimetry and gravimetry, which are coincident and nearly simultaneous with SAR-mode Synthetic aperture Interferometric Radar ALtimeter (SIRAL) data collected by CryoSat. LVIS data were collected on the outbound high-altitude (25,000 feet) flight leg while ATM data were collected on the return, low-altitude (1500 feet) flight leg. CryoSat's SIRAL altimeter data are used to retrieve freeboard, i.e., the height of the ice surface above that of the local sea surface (observed in leads). Freeboard can be used to estimate sea ice thickness by assuming the ice is in isostatic equilibrium. In this investigation we compare freeboard retrievals from CryoSat with freeboard estimates derived using IceBridge data. Corrections for snow thickness are applied using IceBridge radar data. Freeboards retrieved using (a) LVIS data and (b) ATM data, are compared with CryoSat freeboard estimates. These two comparisons taken together provide an important assessment of CryoSat's capabilities to precisely map freeboard and thickness change of Arctic sea ice. -
NLAS: Improving the Accessibility and Utility of Lidar Waveform Data in the Earth Sciences
Crosby, C. J.; Blair, J. B. C. C. C. H. T. M. H. M. A. K. S. S. M. J. M. C. M. N. V. AGU December 2011
Lidar (Light detection and ranging) is finding an increasing number of applications in the Earth sciences. Upward trends in the number of sources and the volume and complexity of lidar data present significant challenges for existing Earth science data systems tasked with serving these data. Moreover, scientists not accustomed to working with lidar often encounter barriers in discovering, accessing, decoding, analyzing and interpreting the data. Conversely, the groups acquiring lidar data struggle to deliver data products in standardized and self-describing formats that allow the various applications communities to fully utilize their data. A collaborative project funded by the NASA ROSES ACCESS program is developing a system that provides access to and services on existing lidar data archives. Working with data from satellite, low- and high-altitude airborne and terrestrial lidar platforms, we are attempting to harmonize the terminology, quality indicators, structure and encodings of these data to improve their accessibility and utility. The Web service-based systems created by this project, called NLAS (NASA Lidar Access System), provide federated access to lidar archives hosted at the National Snow and Ice Data Center DAAC, Goddard Space Flight Center LVIS Data Center, UNAVCO, and the OpenTopography Facility at the San Diego Supercomputing Center (SDSC). NLAS systems will provide access to satellite laser altimetry data from ICESat and high altitude airborne laser scanning data from LVIS, as well as low altitude airborne LiDAR and terrestrial laser scanning data hosted at OpenTopography and UNAVCO. NLAS uses instances of RAMADDA, an open-source, web-based content repository and publishing platform, to service search, subsetting, format conversion, and data transfer requests. Automated metadata extraction and generation by RAMADDA, and the generation of reader code based on a data dictionary, eases data ingest. The OpenTopography portal acts as a client to the NLAS services and provides integrated access to the GSFC and NSIDC-hosted datasets along with OpenTopography hosted data. In addition to providing access to LiDAR point data OpenTopography provides on-demand generation of user-specified derived topographic data products. Data distilled from the 15 standard ICESat products will be made available through NLAS. The LVIS waveform vector is a unique method for storing lidar waveforms that allows end-users to perform their own waveform analysis at full accuracy. An expanded version of this LVIS data product will be available through NLAS. NLAS is also developing a unified lidar data content and encoding convention to enable straightforward and unambiguous interpretation of waveform data (single and multiple waveforms per footprint) with the aim of spurring the broader adoption of both space and airborne lidar waveform data and increase opportunities for joint analysis of such data sets. -
Expanding carbon stock and flux modeling capabilities through the improvement of LiDAR-derived forest age estimates
Duncanson, L.; Dubayah, R. H. G. C. H. C. F. J. P. D. K. AGU December 2011
Understanding the terrestrial carbon cycle is integral to modeling and mitigating global climatic change as well as generating accurate carbon inventory maps. Understanding the relationships between forest function, structure and carbon sequestration is therefore of the utmost importance. Ecosystem models have been developed that estimate future carbon fluxes in forested ecosystems based on forest structural and functional properties. The Ecosystem Demography (ED) model, in particular, has capitalized on the recent availability of LiDAR data over large areas. LiDAR can be used to estimate forest height, and ED is initialized with the distribution of LiDAR heights to estimate carbon flux, assuming a relationship between forest age and height. However, forest height alone is not always an appropriate proxy for age, as forest height can be stunted by environmental constraints. This research attempts to explore how forest age is related to other forest structural attributes, including stand density, canopy gap frequency and vertical structure. LVIS data are used to model and map forest structure along a 2 km wide transect running from Maryland to southern Mississippi. A validated forest disturbance product derived from ~25 years of LANDSAT imagery is used as forest age data. Empirical relationships are developed between forest age and structural metrics. These relationships are also constrained with known allometric scaling relationships that aim to improve model efficacy. If LiDAR data can be used as a suitable proxy for forest age, global LiDAR datasets may be able to provide unprecedented capabilities for modeling global forest carbon stocks and fluxes at present, and into the future. -
Using a semi-automated filtering process to improve large footprint lidar sub-canopy elevation models and forest structure metrics
Fricker, G. A. AGU December 2011
Quantification of sub-canopy topography and forest structure is important for developing a better understanding of how forest ecosystems function. This study focuses on a three-step method to adapt discrete return lidar (DRL) filtering techniques to Laser Vegetation Imaging Sensor (LVIS) large-footprint lidar (LFL) waveforms to improve the accuracy of both sub-canopy digital elevation models (DEMs), as well as forest structure measurements. The results of the experiment demonstrate that LFL ground surfaces can be effectively filtered using methods adapted from DRL point filtering methods, and the resulting data will produce more accurate digital elevation models, as well as improved estimates of forest structure. The first step quantifies the slope present at the center of each LFL pulse, and the average error expected at each particular degree of slope is modeled. Areas of high terrain slope show consistently more error in LFL ground detection, and empirical relationships between terrain angle and expected LVIS ground detection error are established. These relationships are then used to create an algorithm for LFL ground elevation correction. The second step uses an iterative, expanding window filter to identify outlier points which are not part of the ground surface, as well as manual editing to identify laser pulses which are not at ground level. The semi-automated methods improved the LVIS DEM accuracy significantly by identifying significant outliers in the LVIS point cloud. The final step develops an approach which utilizes both the filtered LFL DEMs, and the modeled error introduced by terrain slope to improve both sub-canopy elevation models, and above ground LFL waveform metrics. DRL and LVIS data from Barro Colorado Island, Panama, and La Selva, Costa Rica were used to develop and test the algorithm. Acknowledgements: Special thanks to Dr. Jim Dilling for providing the DRL lidar data for Barro Colorado Island. -
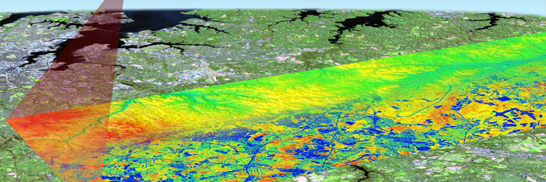
Surface Topographic Changes in Southern Greenland, 2003-2011, Measured Using Space and Airborne Lidar Remote Sensing
Hofton, M. A.; Luthcke, S. B. B. B. AGU December 2011
Airborne laser mapping has numerous applications in Earth science including providing topographic information of ice surfaces for mass balance investigations and dynamical modeling. In April 2011, NASA's Land, Vegetation and Ice Sensor (LVIS) system imaged areas of Greenland as part of NASA's Operation IceBridge on board a KingAir B-200 aircraft from NASA Langley. LVIS is an airborne, medium-footprint (~25 m diameter), wide swath (~2 km) full waveform recording lidar system that has been used extensively for mapping surface structure. The system digitally records the shape of the outgoing and returning laser echo, or waveform which, after its interaction with the various reflecting surfaces of the earth, provides a true 3-dimensional record of the surface structure within each footprint in the data swath. During the mission, over 50,000 km2 of data were collected in the southwest quadrant of Greenland along grid lines offset from each other by 5 km, 10 km or 20 km, oriented along elevation contours, and following ICESat tracks where possible. The data provides a comprehensive topographic sampling of the area to achieve the Icebridge vision of fuller utilization of the ICESat legacy data set and continuing surface elevation change measurements between spaceborne missions. Comparisons to ICESat elevation data are presented to quantify surface changes since 2003 in the area. Up to 6 m of elevation loss over large spatial areas was observed from 2003-2011, extending at least 200 km inland. Comparisons of the magnitude and spatial patterns of change will be made and compared to other methods including GRACE. -
Estimating forest biomass using repeat-pass polarimetric radar interferometry
Lavalle, M.; Simard, M. H. S. AGU December 2011
Biomass is identified by the United Nations Framework Convention on Climate Change (UNFCCC) as an essential climate variable needed to reduce uncertainties in our knowledge of the climate system [1]. Radar remote sensing is the most suitable tool to measure and map Earth's forest biomass, but current methods are limited by saturation issues (backscatter-based methods) or by large uncertainties (interferometric volumetric correlation-based methods) [2]. Here, we developed a new method for estimating forest biomass, which overcomes these limitations. The method utilizes a repeat-pass polarimetric radar interferometer that measures the temporal-volumetric correlation between consecutive radar acquisitions. Using our physical model [3], we are able to relate a set of temporal-volumetric correlation samples (obtained for several combinations of wave polarizations) to important biophysical parameters of forests. We designed a model-based algorithm for parameters estimation that gives maps of forest tree height, using all available information returned by the polarimetric interferometer, including radar backscatter. Forest height estimated from simulated and actual radar UAVSAR data is found in agreement with forest height derived from lidar LVIS data. Height-biomass allometric equations, previously validated with ground observations, are used to estimate the aboveground biomass [4]. Our method allows quantifying the worldwide biomass distribution and monitoring biomass dynamic changes (e.g., deforestation). Future radar missions, such as the NASA/DESDynI, JAXA/ALOS-2 and ESA/BIOMASS can exploit this method [5]. Moreover, our theoretical modeling has unveiled new insights into the temporal decorrelation, such as the dependence on wave polarization and target structure [3], bringing benefits to all techniques exploiting radar time series, beyond the remote sensing of vegetated lands. -
Waveform LiDAR across forest biomass gradients
Montesano, P. M. AGU December 2011
Detailed information on the quantity and distribution of aboveground biomass (AGB) is needed to understand how it varies across space and changes over time. Waveform LiDAR data is routinely used to derive the heights of scattering elements in each illuminated footprint, and the vertical structure of vegetation is related to AGB. Changes in LiDAR waveforms across vegetation structure gradients can demonstrate instrument sensitivity to land cover transitions. A close examination of LiDAR waveforms in footprints across a forest gradient can provide new insight into the relationship of vegetation structure and forest AGB. In this study we use field measurements of individual trees within Laser Vegetation Imaging Sensor (LVIS) footprints along transects crossing forest to non-forest gradients to examine changes in LVIS waveform characteristics at sites with low (< 50Mg/ha) AGB. We relate field AGB measurements to original and adjusted LVIS waveforms to detect the forest AGB interval along a forest - non-forest transition in which the LVIS waveform lose the ability to discern differences in AGB. Our results help identify the lower end the forest biomass range that a ~20m footprint waveform LiDAR can detect, which can help infer accumulation of biomass after disturbances and during forest expansion, and which can guide the use of LiDAR within a multi-sensor fusion biomass mapping approach. -
Discrete Lidar Pseudo-Waves Versus True Waveform lidar: Are They Fungible for Forest Structural Analyses?
Muss, J. D.; Aguilar-Amuchastegui, N. S. E. H. G. M. AGU December 2011
In the past three decades, two types of lidar systems, discrete and waveform, have been used to estimate forest structure, including height, biomass, and basal area. While there are many similarities between these two systems, their fundamental differences are the manner in which the laser backscatter is recorded and, to a lesser degree, how these data are analyzed. Typically, discrete systems record far fewer returns per pulse, but provide fine-scale, three-dimensional positions of reflecting surfaces, whereas waveform lidar captures much more of the backscattered energy at the expense of knowing the precise location of the reflectors. Despite these differences, these data have, overwhelmingly, been analyzed using frequency-based statistics, even though this results in highly correlated metrics and may sacrifice a wealth of structural information that could be latent within the waveforms. Some recent studies have challenged this approach and introduced methods to aggregate discrete lidar data into pseudo-waves, and investigated alternative methods to examine these waves to improve assessments of forest-structure. We propose that the differences between pseudo-waves and true waveforms are minor, and that the same wave-based metrics can be used to analyze either surface. To test these propositions, pseudo-waves are being created from discrete lidar data collected in the spring of 2006, over the La Selva Biological Station in Costa Rica. These pseudo-waves are being geographically co-registered to full-waveform data collected in 2005 over the same area using the LVIS sensor. The two sets of waves will be normalized so that similarities in their shapes can be evaluated, after which we will demonstrate that wave-based metrics, which have been used to relate pseudo-waves to estimate canopy heights, basal area, and biomass in temperate forests can also be used to describe forest structure in the tropics. -
Generation of a new Greenland Ice Sheet Digital Elevation Model
Nagarajan, S.; Csatho, B. M. S. A. F. B. G. S. S. T. A. H. T. M. K. K. H. K. N. J. AGU December 2011
Currently available Digital Elevation Models(DEMs) of the Greenland Ice Sheet (GrIS) were originally derived from radar altimetry data, e.g. Bamber (Bamber et al., 2001) and later improved by photoclinometry to fill the regions between orbits (Scambos and Haran, 2002). The elevation error of these DEMs is a few meters in the higher part (above 2000 m) of the ice sheet, but it can be as much as 50-100 meters in marginal regions. The relatively low resolution and accuracy poses a problem, especially for ice sheet modeling. Although accurate elevation data have been collected by airborne and spaceborne laser altimetry (airborne: Airborne Topographic Mapper (ATM) (1993-present), Laser Vegetation Imaging Sensor(LVIS) (2007,2009 and 2011); spaceborne: Ice, Cloud, and land Elevation Satellite (ICESat) (2003-2009)) and DEMs have been derived from stereo satellite imagery (e.g., SPOT (40 m), ASTER (15 m)), a high resolution, consistent DEM of GrIS is not yet available. This is due to various problems, such as different error sources in the data and different dates of data acquisition. In order to overcome these difficulties, we generated a multi-resolution DEM of GrIS, reflecting June 2008 conditions, by fusing a photoclinometry DEM, SPOT and ASTER DEMs as well as elevations from ICESat, ATM and LVIS laser altimetry. The new multi-resolution DEM has a resolution of 40 m x 40 m in the marginal ice sheet regions and 250 m elsewhere. The ice sheet margin is mapped from SPOT and Landsat imagery and SPOT DEMs are used to cover the complex topography of ice sheet marginal regions. The accuracy of SPOT DEMs is approximately ± 6 m except in the areas covered by clouds regions, where the SPOT elevations were replaced by ASTER DEMs. The ASTER DEMs were checked and improved by the DEM derived from aerial photography from the 1980s. A new photoclinometry DEM, derived from Advanced Very High Resolution Radiometer (AVHRR) and Moderate Resolution Imaging Spectroradiometer (MODIS) imagery provide a 250-meter resolution base topography at the higher elevations. ICESat and ATM and LVIS laser altimetry observations are used to improve the absolute elevation accuracy by computing the difference between the base DEM and point elevations, followed by 'distributing' the differences over the DEM using kriging interpolation. Adding these interpolated differences to the elevations at the grid posts results in an updated DEM. Finally, all elevations were corrected using elevation changes determined by SERAC (Surface Elevation Reconstruction And Change detection), to achieve a common reference date. Airborne laser altimetry elevations are used to evaluate the accuracy of the new GrIS DEM. -
Determination of vegetation canopy structure and biomass using a fully polarimetric repeat-pass L-band radar
Simard, M.; Lavalle, M. P. N. H. S. D. R. AGU December 2011
We use the UAVSAR, an airborne fully polarimetric L-band radar system, to estimate forest canopy structure and biomass through radar backscatter and repeat-pass interferometry. UAVSAR provides backscatter images with a spatial resolution of 5m and is capable of repeat-pass interferometry. Our analysis also includes data from LVIS (Laser vegetation Imaging sensor), which serve as a validation dataset but also provide a priori knowledge for our forest structure model. LVIS is a laser altimeter providing a spatially dense sampling of full waveforms with a footprint of 25m. During the UAVSAR data collection campaigns, we collected weather (wind, precipitation and temperature) as well as forest structure data in a total of 95 plots. The plot measurements included, trunk diameter at breast height, tree height and species as well as terrain slopes. These field data were used to estimate canopy density, height and biomass at the stand level. The main objective of the UAVSAR campaign was to characterize, quantify and mitigate the impact of temporal decorrelation on the estimation of canopy height by radar interferometry. However, we also compare the radar backscatter with the field estimates of stand biomass, to assess its potential. On the other hand, a polarimetric interferometric model is used to estimate vegetation height from radar interferometry (polinSAR). The polinSAR model relies on the measurement of correlation and phase as different polarizations. However, since UAVSAR is a repeat-pass interferometric system, slight changes within the canopy (e.g. due to weather and motion of scatterers) between radar acquisitions tend to decorrelate successive radar images. This effect can be taken into account within the polinSAR model but strongly depends on the assumed temporal decorrelation. We designed the UAVSAR campaign to quantify temporal decorrelation. Within a period of two weeks, we collected several days of data at different time intervals in order to sample several temporal baselines. To minimize the impact of temporal decorrelation, we collected an inSAR pair with a zero and 65m baseline for each of the 3 days. Given the UAVSAR flew the same track within about 2.5m at an altitude of 12.5km, the zero baseline flights were well suited to quantify temporal decorrelation. The same tracks were repeated each day which enables us to form stacks of interferograms. This comprehensive experiment enabled quantification of the temporal decorrelation and its relationship to polarization, time intervals, weather patterns, terrain slope, forest type and canopy structure. The main factors influencing inSAR correlation are canopy structure and changes in weather. The measurements of temporal decorrelation from the zero baseline pairs were then used to correct the finite baseline interferograms and solve for volume decorrelation. We provide a comparison of the backscatter and polinSAR approaches and discuss their limitations. We obtain different results in boreal, temperate and tropical sites, in part due to canopy structure and range of biomass, but also due to moisture variations and other geophysical parameters such as topography. -
NASA's Operation IceBridge: using instrumented aircraft to bridge the observational gap between ICESat and ICESat-2 laser altimeter measurements
Studinger, M. AGU December 2011
In 2009, the NASA satellite laser altimeter mission ICESat (Ice, Cloud and Land Elevation Satellite), which was launched in 2003, ceased to operate. To bridge the gap in polar laser observations between ICESat and its replacement ICESat-2, scheduled for launch in 2016, Operation IceBridge was initiated in 2009. From a series of yearly polar flights, Operation IceBridge uses airborne instruments to map rapidly changing areas in the Arctic and Antarctic, building on two decades of repeat airborne and satellite measurements. Combined with previous aircraft observations, as well as ICESat, CryoSat-2 and the forthcoming ICESat-2 observations, Operation IceBridge will produce a cross-calibrated 17-year time series of ice sheet and sea-ice elevation data over Antarctica, as well as a 27-year time series over Greenland. These time series will be a critical resource for predictive models of sea ice and ice sheet behavior. In addition to laser altimetry, Operation IceBridge is using a comprehensive suite of instruments to produce a three-dimensional view of the Arctic and Antarctic ice sheets, ice shelves and the sea ice. The suite includes two NASA laser altimeters, the Airborne Topographic Mapper (ATM) and the Land, Vegetation and Ice Sensor (LVIS); four radar systems from the University of Kansas' Center for Remote Sensing of Ice Sheets (CReSIS), a Ku-band radar altimeter, accumulation radar, snow radar and the Multichannel Coherent Radar Depth Sounder (MCoRDS); a Sander Geophysics airborne gravimeter (AIRGrav), a magnetometer and a high-resolution stereographic camera (DMS). Since its start in 2009, Operation IceBridge has deployed 5 geophysical survey aircraft, 16 science instruments, and has flown 1,613 hours during 181 science missions covering over 760,000 flight kilometer. All IceBridge data is freely available from NSIDC (http://nsidc.org/data/icebridge) 6 months after completion of a campaign. -
Analysis of Tropical Forest Structure Dynamics Using Medium-footprint Lidar and Landsat Time Series Stacks
Tang, H.; Huang, C. D. R. AGU December 2011
Forest often recovers after a disturbance event until it reaches an equilibrium stage. This process can be observed through examining several geophysical parameters (e.g. biomass, canopy height and LAI). Quantifying these parameters at fine scale is important for understanding carbon stocks and fluxes. The La Selva Biological Station in Costa Rica is a good example for studying secondary forest regrowth from disturbance. Since Lidar can provide the most accurate estimate of biomass compared to other remote sensing methods and Landsat has produced the longest imagery record of forest, we will explore the dynamics of tropical forest with both medium footprint lidar and landsat images. LVIS, a medium footprint airborne scanning lidar, has surveyed this area in March of 1998 and 2005. A highly automated algorithm, vegetation change tracker (VCT) has been developed for reconstructing recent forest disturbance history starting from 1984 using Landsat time series stacks (LTSS).Need to discuss what you will do, what are the expected results and their significances. We will try to establish empirical relationship between Lidar and landsat images to analysis tropical forest dynamics from 1984 to 2005. -
Detecting forest canopy layering: applying lidar remote sensing to further understand the role of vertical structure in species habitat preference
Whitehurst, A. S. AGU December 2011
Full waveform lidar reflects off all forest canopy elements, showing not only height, but also the structure within the canopy from the top to the forest floor, making it an ideal remote sensing technology for research in forest ecosystem dynamics. Vertical stratification or canopy layering has long been noted as an essential element in the forest ecosystem and of importance for species habitat. This project explores the utility of lidar for characterizing forest canopy layering and applying canopy layering information to better understand species habitat preference. Canopy layering will be mapped across the landscape using full-waveform lidar remote sensing data from the NASA Goddard Space Flight Center Laser Vegetation Imaging Sensor (LVIS). Two methods for quantifying layering have been developed from LVIS data collected during the summer of 2009 for Hubbard Brook Experimental Forest, New Hampshire. The two layering datasets (one categorical, one continuous) describe how vertical stratification varies across the forest with canopy height and elevation. The relationships between of canopy layering and avian species habitat preference will also be assessed for bird species within Hubbard Brook Experimental forest. These results will provide ecologically meaningful information and a relevant method for quantifying canopy layering at the landscape scale, which will aid in a better understanding of forest ecosystem dynamics for forest management and species habitat research. -
Studying the Impact of the Three Dimensional Canopy Structure on LIDAR Waveforms Evaluated with Field Measurements
Xu, L.; Knyazikhin, Y. M. R. B. S. A. H. S. C. A. A. S. M. P. R. AGU December 2011
The three-dimensional structure of a forest - its composition, density, height, crown geometry, within-crown foliage distribution and properties of individual leaves - has a direct impact on the lidar waveform. The pair-correlation function defined as the probability of finding simultaneously phytoelements at two points is the most natural and physically meaningful descriptor of the canopy structure over wide range of scales. The stochastic radiative transfer equations naturally admit this measure and thus provide a powerful means to investigate 3D canopy from space. NASA's Airborne Laser Vegetation Imaging Sensor (LVIS) and ground based data on canopy structure acquired over 5 sites in New England, California and La Selva (Costa Rica) tropical forest were analyzed to assess the impact of 3D canopy structure on lidar waveform and the ability of stochastic radiative transfer equations to simulate the 3D effects. Our results suggest the pair correlation function is sensitive to horizontal and vertical clumping, crown geometry and spatial distribution of trees. Its use in the stochastic radiative transfer equation allows us to accurately simulate the effects of 3D canopy structure on the lidar waveform. Specifically, we found that (1) attenuation of the waveform occurs at a slower rate than 1D models predict; this may result in an underestimation of foliage profile if 3D effects are ignored; (2) 1D model is unable to match simulated waveform and measured surface reflectance, i.e., an unrealistic high value of surface reflectance needs to be used to simulate ground return of sparse vegetation; (3) spatial distribution of trees has a strong impact on the lidar waveform. Simple analytical models of the pair-correlation function will also be discussed. -
Monitoring Forest Change and Ice Storm Disturbance to Forest Structure Using Echidna® Ground-Based Lidar
Yao, T.; Strahler, A. H. S. C. Y. X. z. F. W. C. E. J. D. L. C. D. L. J. N. G. L. X. W. J. AGU December 2011
he ground-based, upward-scanning, near-infrared (1064 nm), full-waveform lidar, the Echidna° Validation Instrument (EVI), built by CSIRO Australia, is used to monitor forest change over a 2- or 3-year time period through changes in retrievals of mean stem diameter, stem density, basal area, above-ground standing biomass, leaf area index, foliage profile, and canopy height. The changes were validated by comparison with direct field measurements, or in the case of canopy height, with data from the Laser Vegetation Imaging Sensor (LVIS). Site-level EVI-retrieved values of mean DBH, stem count density, basal area and above-ground biomass matched the field measurements well, with R2 values of 0.84, 0.97, 0.96 and 0.98 respectively. Furthermore, the changes in EVI retrievals had the same trend as the change in field measurements over these 2-3 year periods. Based on five scans within each 1-ha plot, we focused on detecting forest change over a 2- or 3-year period at three New England forest stands: a second-growth conifer stand thinned as a shelterwood, an aging hemlock plantation, and a young second-growth hardwood stand. The first stand provided the opportunity to look for change in a stand containing many co-dominant and intermediate trees recently released by removal of selected over-story trees, while the other two stands suffered significant damage in an ice storm during the change period. At the shelterwood conifer site at Howland Experimental Forest, mean DBH, aboveground biomass, and leaf area index (LAI) all increased between 2007 and 2009. An ice storm struck the Harvard Forest in December, 2008, providing the opportunity to detect damage between 2007 and 2009 or 2010 with EVI scans at two sites : hemlock and hardwood. Retrieved leaf area index (LAI) was 13 percent lower in the hemlock site in 2009 and 10 percent lower in the hardwood site in 2010 as compared to 2007. The decrease of LAI quantifies a loss of biomass from the canopy, and broken tops were both recorded by the field teams and visible in the Echidna scans in the 2010 data. Stem density decreased and mean DBH increased at both sites, as smaller and weaker trees were felled by the ice. Canopy heights derived from the EVI-retrieved foliage profile closely matched those derived from the airborne Laser Vegetation Imaging Sensor (LVIS).
Return to the top of the page

- Responsible NASA Official : J. Bryan Blair
- Web Curator: Albert Wu
- Privacy Policy & Important Notices
- Report a Problem
- Accessibility Statement
- Page Last Updated: 16-Mar-2018