Follow LVIS
External Links
- 61A: Geodesy and Geophysics Laboratory
- Operation IceBridge
- ABoVE
- NSIDC
- GEDI
- GRACE
- University of Maryland
Recent News
LVIS featured on #ScienceInSeconds
28 Jul 2021
Dr. Michelle Hofton was interviewed for NASA Associate Administrator Dr. Thomas Zurbuchen's Twitter update during the 2021 GEDI Calibration/Validation campaign!
Greenland data available at NSIDC
14 Jun 2018
LVIS Level 1B and 2 data products from Operation IceBridge Greenland 2017 are now available at NSIDC. Links are now available here!
ABoVE data available at NSIDC
9 May 2018
LVIS Level 1B and 2 data products from ABoVE 2017 are now available at NSIDC, and the IceBridge 2017 data products have been sent out. Take a look here!
ABoVE data sent to NSIDC
8 Mar 2018
LVIS data from ABoVE 2017 has been sent to NSIDC. As soon as the data is available, links will be posted here!
-
Development of a High-Altitude, High-Accuracy, Wide-Swath Imaging Laser Altimeter Capability for the Global Hawk UAV Aircraft
Blair, J. B. AGU December 2009
LVIS (pronounced “Elvis”) is a medium/high-altitude wide-swath laser altimeter that has, for over a decade, demonstrated state-of-the-art performance in measuring vegetation structure, and the topography of land, oceans, ice sheets, and sea ice. A new version of this instrument is currently under development that will be capable of an improved level of performance and modified for operations in a high-altitude, autonomous environment, specifically for use in the Global Hawk aircraft. This new design is based on the existing LVIS instrument, and utilizes several subsystems (i.e. the aircraft structure, the pressure enclosure, and the data system) that were recently developed for the Cloud Precipitation Lidar (CPL) recently integrated onto the Global Hawk. The new LVIS instrument will incorporate some of the latest in NASA- and commercially-developed lasers, detectors, digitizers, and imaging systems resulting in an autonomous, high-altitude, wide-swath, full-waveform laser altimeter. This high-altitude version of LVIS will provide high-quality large area data sets for Cryospheric, Solid Earth, and Ecosystem science, for cal/val and supplementing the upcoming ICESat-2 and DESDynI lidar missions, and regional data coverage in a cost-effective manner to enable new science applications. This high-accuracy, wide-swath mapping capability combined with the extraordinary range and endurance of the Global Hawk aircraft enables orders of magnitude more coverage and access to remote areas such Antarctica. Further, this advanced version of LVIS will serve as an operational prototype of the Lidar for Surface Topography (LIST) Decadal Survey Mission Lidar instrument and measurement capability, and potentially in support of the National Lidar Mapping Initiative. -
Accuracy of DESDynI Biomass Estimates using Lidar and Data Fusion Methods
Cook, B. D.; Sun, G. R. K. J. M. P. M. L. S. B. B. J. B. AGU December 2009
DESDynI (Deformation, Ecosystem Structure and Dynamics of Ice) is a NASA satellite mission that will provide global estimates of aboveground biomass at a maximum spatial resolution of 500 m and an accuracy of ±10 Mg C ha-1 (up to 20% of the total) after 5 years. This will be accomplished by 1) developing algorithms to predict biomass from full waveform lidar returns; 2) sub-sampling grid cells along contiguous tracks with an orbiting multi-beam lidar; and 3) fusing lidar observations with radar and multispectral data to upscale biomass estimates within grid cells. Uncertainties exist at each stage of this process, and the goal of this study was to perform an accuracy assessment and to identify steps where improvements might be needed. Summer field campaigns were conducted in 2003 and 2009 to collect ground-based measurements and remote sensing data for study areas in the boreal transition zone near Howland, Maine, USA. Model parameters and uncertainties associated with biomass predictions from lidar data were estimated using Bayesian methods, and information criterion were used to select models based on simplicity and goodness of fit. DESDynI orbits were simulated and used to subsample airborne scanning lidar data the Laser Vegetation Imaging Sensor (LVIS), and up-scaling to 500 m grid cells was accomplished with ASTER multispectral data and L-band radar available from satellite and airborne platforms (ALOS/PALSAR and UAVSAR, respectively). Methods developed for this case study will be applied to other DESDynI field campaign sites to obtain accuracy assessments for other forest ecosystems. -
Exploring Research Contributions of the North American Carbon Program using Google Earth and Google Map
Griffith, P. C.; Wilcox, L. E. M. A. AGU December 2009
The central objective of the North American Carbon Program (NACP), a core element of the US Global Change Research Program, is to quantify the sources and sinks of carbon dioxide, carbon monoxide, and methane in North America and adjacent ocean regions. The NACP consists of a wide range of investigators at universities and federal research centers. Although many of these investigators have worked together in the past, many have had few prior interactions and may not know of similar work within knowledge domains, much less across the diversity of environments and scientific approaches in the Program. Coordinating interactions and sharing data are major challenges in conducting NACP. The Google Earth and Google Map Collections on the NACP website (www.nacarbon.org) provide a geographical view of the research products contributed by each core and affiliated NACP project. Other relevant data sources (e.g. AERONET, LVIS) can also be browsed in spatial context with NACP contributions. Each contribution links to project-oriented metadata, or “project profiles”, that provide a greater understanding of the scientific and social context of each dataset and are an important means of communicating within the NACP and to the larger carbon cycle science community. Project profiles store information such as a project's title, leaders, participants, an abstract, keywords, funding agencies, associated intensive campaigns, expected data products, data needs, publications, and URLs to associated data centers, datasets, and metadata. Data products are research contributions that include biometric inventories, flux tower estimates, remote sensing land cover products, tools, services, and model inputs / outputs. Project leaders have been asked to identify these contributions to the site level whenever possible, either through simple latitude/longitude pair, or by uploading a KML, KMZ, or shape file. Project leaders may select custom icons to graphically categorize their contributions; for example, a ship for oceanographic samples, a tower for tower measurements. After post-processing, research contributions are added to the NACP Google Earth and Google Map Collection to facilitate discovery and use in synthesis activities of the Program. -
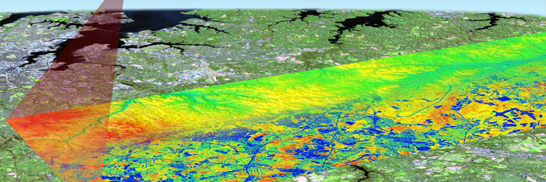
Precise and Accurate High-Altitude Waveform Lidar Mapping of Greenland Land and Arctic Sea Ice in Support of Operation IceBridge
Hofton, M. A.; Luthcke, S. B. B. J. B. R. D. M. C. AGU December 2009
NASA's LVIS is an airborne, medium-footprint (25m diameter), full waveform-recording, airborne, scanning lidar system that has been used extensively for mapping surface structure for various scientific investigations. The system digitally records the shape of the returning laser echo, or waveform, after its interaction with the various reflecting surfaces of the earth, providing a true 3-dimensional record of the surface structure within each footprint in the data swath. In April 2009, the system was flown over regions of the Greenland ice sheet and Arctic Ocean on board NASA’s P3-B aircraft as part of NASA’s Operation IceBridge. Flying at ~8 km altitude, using ~25 m-wide laser footprints that were contiguous along and across-track within the ~1.5-wide laser swath, a total of ~9,800 lineal km of ICEsat repeat ground-track "corridors" over land and sea ice were imaged during three flights, including ~1,200 lineal km that were imaged previously using LVIS in September 2007. Data collected included ground elevation and vertical extent measurements for each laser footprint, as well as the vertical distribution of intercepted surfaces (the return waveform) from which surface slope, roughness and other metrics can be extracted. Data precision and accuracy are assessed, including as a function of surface conditions. Data along four long (>1,000 km) tracks of data are compared to cotemporal, coincident data collected by ICESat in order to establish the accuracy of the sensor-to-sensor comparison under various surface conditions. These data, along with data collected by the other sensors involved in Operation IceBridge, form the basis for future repeat surveys of the ice sheet and its margins from the air during the data gap between the current orbital ICESat and future lidar missions. In particular, the data set collected using the LVIS sensor will provide a consistent datum to enable inter-mission calibration and validation as well as the separation of inter-mission observational system biases and errors from true decadal and seasonal surface elevation change. -
Assessing General Relationships Between Above-Ground Biomass and Vegetation Structure Parameters for Improved Carbon Estimate from Lidar Remote Sensing
Ni-Meister, W. AGU December 2009
Lidar remote sensing uses vegetation height to estimate large-scale above-ground biomass. However, lidar height and biomass relationships are empirical and thus often lead to large uncertainties in above-ground biomass estimates. This study uses vegetation structure measurements from field: an airborne lidar (Laser Vegetation Imaging Sensor, LVIS)) and a full wave form ground-based lidar (Echidna® validation instrument, EVI) collected in the New England region in 2003 and 2007, to investigate using additional vegetation structure parameters besides height for improved above-ground biomass estimation from lidar. Our field data analysis shows that using woody volume (approximated by the product of basal area and top 10% tree height) and vegetation type (conifer/softwood or deciduous/hardwood forests, providing wood density) has the potential to improve above-ground biomass estimates at large scale. This result is comparable to previous work by Chave et al. (2005), which focused on individual trees. However this study uses a slightly different approach, and our woody volume is estimated differently from Chave et al. (2005). Previous studies found that RH50 is a good predictor of above-ground biomass (Drake et al., 2002; 2003). Our LVIS data analysis shows that structure parameters that combine height and gap fraction, such as RH100*cover and RH50*cover, perform similarly or even better than RH50. We also found that the close relationship of RH100*cover and RH50*cover with woody volume explains why they are good predictors of above-ground biomass. RH50 is highly related to RH100*cover, and this explains why RH50 is a better predictor of biomass than RH100. This study shows that using structure parameters combining height and gap fraction improve above-ground biomass estimate compared to height alone, and fusion of lidar and optical remote sensing (to provide vegetation type) will provide better above-ground biomass estimates than lidar alone. Ground lidar analysis shows that EVI provides good estimates of woody volume, and thus accurate estimates of above-ground biomass particularly at the stand level. Our study demonstrates the ability of EVI for accurate estimate of above-ground biomass at the stand level. -
Monitoring Forest Degradation from Lidar Waveform Data
Ranson, J. AGU December 2009
One of the objectives of NASA DESDynI (Deformation, Ecosystem Structure and Dynamics of Ice) Mission is to characterize terrestrial ecosystems with respect to biomass, biodiversity, and disturbance/change through time. Forest degradation, which was defined by the UNFCCC (COP-13) as any forest that has experienced a loss, is an important aspect of forest disturbance. DESDynI, utilizes both lidar and radar to characterize forest 3-D structure to provide accurate estimates of the changes in biomass which is important for monitoring forest degradation. Other forest structural parameters may also be useful and can be mapped for monitoring forest degradation/disturbances. The forests in the Howland, Maine area consist of undisturbed near-mature forest, and forests with early clear cuts, strip cuts, and recent selective cuts. These forest management approaches reduce the biomass, and have different effects on canopy heights. For example, selective harvesting may remove a significant proportion of the biomass without drastically changing height. The effects of this on the lidar waveforms must be understood. In this study, a lidar waveform model will be used to simulate the effects of various forest management practices on the lidar waveform. IKONOS images, LVIS (Laser Vegetation Imaging Sensor) data, and field measurements will be used to investigate the characteristics of lidar waveforms, identify the significant changes of the waveform, and correlate these changes with the forest structural changes. The results from this study will provide insight and protocols for monitoring forest degradation from lidar waveform data. -
Lidar modeling with the 3D DART model
Rubio, J.; Grau, E. S. G. G. E. J. R. K. J. AGU December 2009
A new lidar waveform module is introduced in the optical-thermal model DART (Discrete Anisotropic Radiative Transfer), a 3D radiative transfer model in the optical and thermal domains. It takes advantage of the DART detailed representation of the landscape that can be natural and urban, with the possibility to include atmosphere and topography. It relies on a Monte Carlo Ray tracing approach that was previously used for checking the accuracy of the iterative ray tracing approach of DART. A major point Is that it inherits major features of the DART model; possibility to combine different vegetation species, etc. It permits to calculate the resulting lidar waveform, using 1st order of scattering or including multiple scattering. It is suited for both small and large footprints with an emphasis on large footprint lidar. For validation of the DART lidar model, comparisons took place with the 3D lidar waveform model of Sun and Ranson. Due to the flexibility of the DART model, the two lidar models can share common input parameters. Moreover, they are based on the same physical principles. Then, the potential of the model was further assessed using LVIS data acquired in the northern experimental forest (Maine, USA). Finally, the DART lidar model was used for investigating the importance of multiple scattering within canopy. -
ESTIMATION OF TROPICAL FOREST STRUCTURE AND BIOMASS FROM FUSION OF RADAR AND LIDAR MEASUREMENTS (Invited)
Saatchi, S. S.; Dubayah, R. C. D. B. C. R. AGU December 2009
Radar and Lidar instruments are active remote sensing sensors with the potential of measuring forest vertical and horizontal structure and the aboveground biomass (AGB). In this paper, we present the analysis of radar and lidar data acquired over the La Selva Biological Station in Costa Rica. Radar polarimetry at L-band (25 cm wavelength), P-band (70 cm wavelength) and interferometry at C-band (6 cm wavelength) and VV polarization were acquired by the NASA/JPL airborne synthetic aperture radar (AIRSAR) system. Lidar images were provided by a large footprint airborne scanning Lidar known as the Laser Vegetation Imaging Sensor (LVIS). By including field measurements of structure and biomass over a variety of forest types, we examined: 1) sensitivity of radar and lidar measurements to forest structure and biomass, 2) accuracy of individual sensors for AGB estimation, and 3) synergism of radar imaging measurements with lidar imaging and sampling measurements for improving the estimation of 3-dimensional forest structure and AGB. The results showed that P-band radar combined with any interformteric measurement of forest height can capture approximately 85% of the variation of biomass in La Selva at spatial scales larger than 1 hectare. Similar analysis at L-band frequency captured only 70% of the variation. However, combination of lidar and radar measurements improved estimates of forest three-dimensional structure and biomass to above 90% for all forest types. We present a novel data fusion approach based on a Baysian estimation model with the capability of incorporating lidar samples and radar imagery. The model was used to simulate the potential of data fusion in future satellite mission scenarios as in BIOMASS (planned by ESA) at P-band and DESDynl (planned by NASA) at L-band. The estimation model was also able to quantify errors and uncertainties associated with the scale of measurements, spatial variability of forest structure, and differences in radar and lidar geometry and pixel locations. Keywords: Amazon, Biomass, Carbon, Forest Structure, Tropical forests, Radar, Polarimetry, Interferometry, Lidar This work is performed partially at the Jet Propulsion Laboratory, California Institute of Technology, under contract from National Aeronautic and Space Administration. -
Canopy Vertical Spatial Scales which Constrain Biomass in a Tropical Forest at the Plot Level: Unifying Lidar and InSAR for Biomass Estimation
Treuhaft, R. N.; Goncalves, F. G. D. J. B. C. B. D. D. S. J. R. D. L. V. G. P. M. P. G. H. AGU December 2009
Structural remote sensing of forest biomass, using lidar and/or interferometric synthetic aperture radar (InSAR), often involves regressing field measured biomass against remotely sensed characteristics of the vertical density profile. Because spaceborne lidar or InSAR sensors will estimate structural characteristics averaged at the plot level (0.04-1 hectare), and because tropical forests contain 40% of the Earth’s forested biomass, this study focuses on the scales of vertical characteristics which best correlate with tropical forest biomass. This work suggests that the structural characteristics used in both lidar and InSAR biomass estimation, such as mean height or total height or height of median energy, are based on the behavior of Fourier vertical frequency components of vegetation density near zero frequency; that is, they are very low-spatial frequency characteristics of the vertical vegetation distribution. In this work, we ask which other vertical Fourier frequencies in lidar- or InSAR-produced structure metrics can best correlate with field biomass. Using lidar (LVIS) data from La Selva Biological Station, Costa Rica, taken in 2005, lidar canopy observations are Fourier transformed in the vertical direction to decompose into vertical frequency components. Each baseline of an InSAR observation, the complex coherence, is this Fourier transform of the canopy, if the ground contribution can be neglected. Using the qualitative similarity in vertical profiles seen by lidar, InSAR (at C-band, from AirSAR in 2004), and field measurements in the La Selva data, we produce the equivalent many (1000’s of) InSAR baselines from the lidar data and, using the lidar-simulated InSAR, determine the optimal spatial frequencies—baselines at DESDynI orbital altitudes for InSAR—which would estimate biomass in this wet tropical forest most accurately for either technique. For biomass ranging from 39-490 Mg/ha, regressing field biomass against some function of height (average or total) yields RMS prediction scatters of 90 Mg/ha from either lidar or InSAR. By using higher spatial Fourier frequencies with vertical wavelengths between 100-200 m and 10-20 m (at the smallest), with up to 8 parameters describing the Fourier amplitudes and phases at each frequency, the RMS scatters decrease to about 60 Mg/ha from lidar, and 75 Mg/ha from the available InSAR baselines. Error budgets for each technique will attempt to account for the performance difference in biomass estimation. DESDynI relevant performance enhancements include optimal lidar design or operation modes to capture the 100-10m spatial frequencies. Optimal InSAR baselines will be considered for biomass estimation based on vertical Fourier decomposition. We also explore the potential of unified, quantitative lidar-InSAR fusion schemes which cull optimal, and possibly different, vertical frequency components from each technique.
Return to the top of the page

- Responsible NASA Official : J. Bryan Blair
- Web Curator: Albert Wu
- Privacy Policy & Important Notices
- Report a Problem
- Accessibility Statement
- Page Last Updated: 16-Mar-2018