Follow LVIS
External Links
- 61A: Geodesy and Geophysics Laboratory
- Operation IceBridge
- ABoVE
- NSIDC
- GEDI
- GRACE
- University of Maryland
Recent News
LVIS featured on #ScienceInSeconds
28 Jul 2021
Dr. Michelle Hofton was interviewed for NASA Associate Administrator Dr. Thomas Zurbuchen's Twitter update during the 2021 GEDI Calibration/Validation campaign!
Greenland data available at NSIDC
14 Jun 2018
LVIS Level 1B and 2 data products from Operation IceBridge Greenland 2017 are now available at NSIDC. Links are now available here!
ABoVE data available at NSIDC
9 May 2018
LVIS Level 1B and 2 data products from ABoVE 2017 are now available at NSIDC, and the IceBridge 2017 data products have been sent out. Take a look here!
ABoVE data sent to NSIDC
8 Mar 2018
LVIS data from ABoVE 2017 has been sent to NSIDC. As soon as the data is available, links will be posted here!
Interview with LVIS PI, Bryan Blair.
Other Images & Multimedia
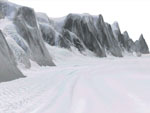
Crane Glacier
This movie shows a virtual fly through of the Crane Glacier in the Antarctic Peninsula. The imagery is from
the Digital Mapping System (DMS) and it is draped on the LVIS DEM.
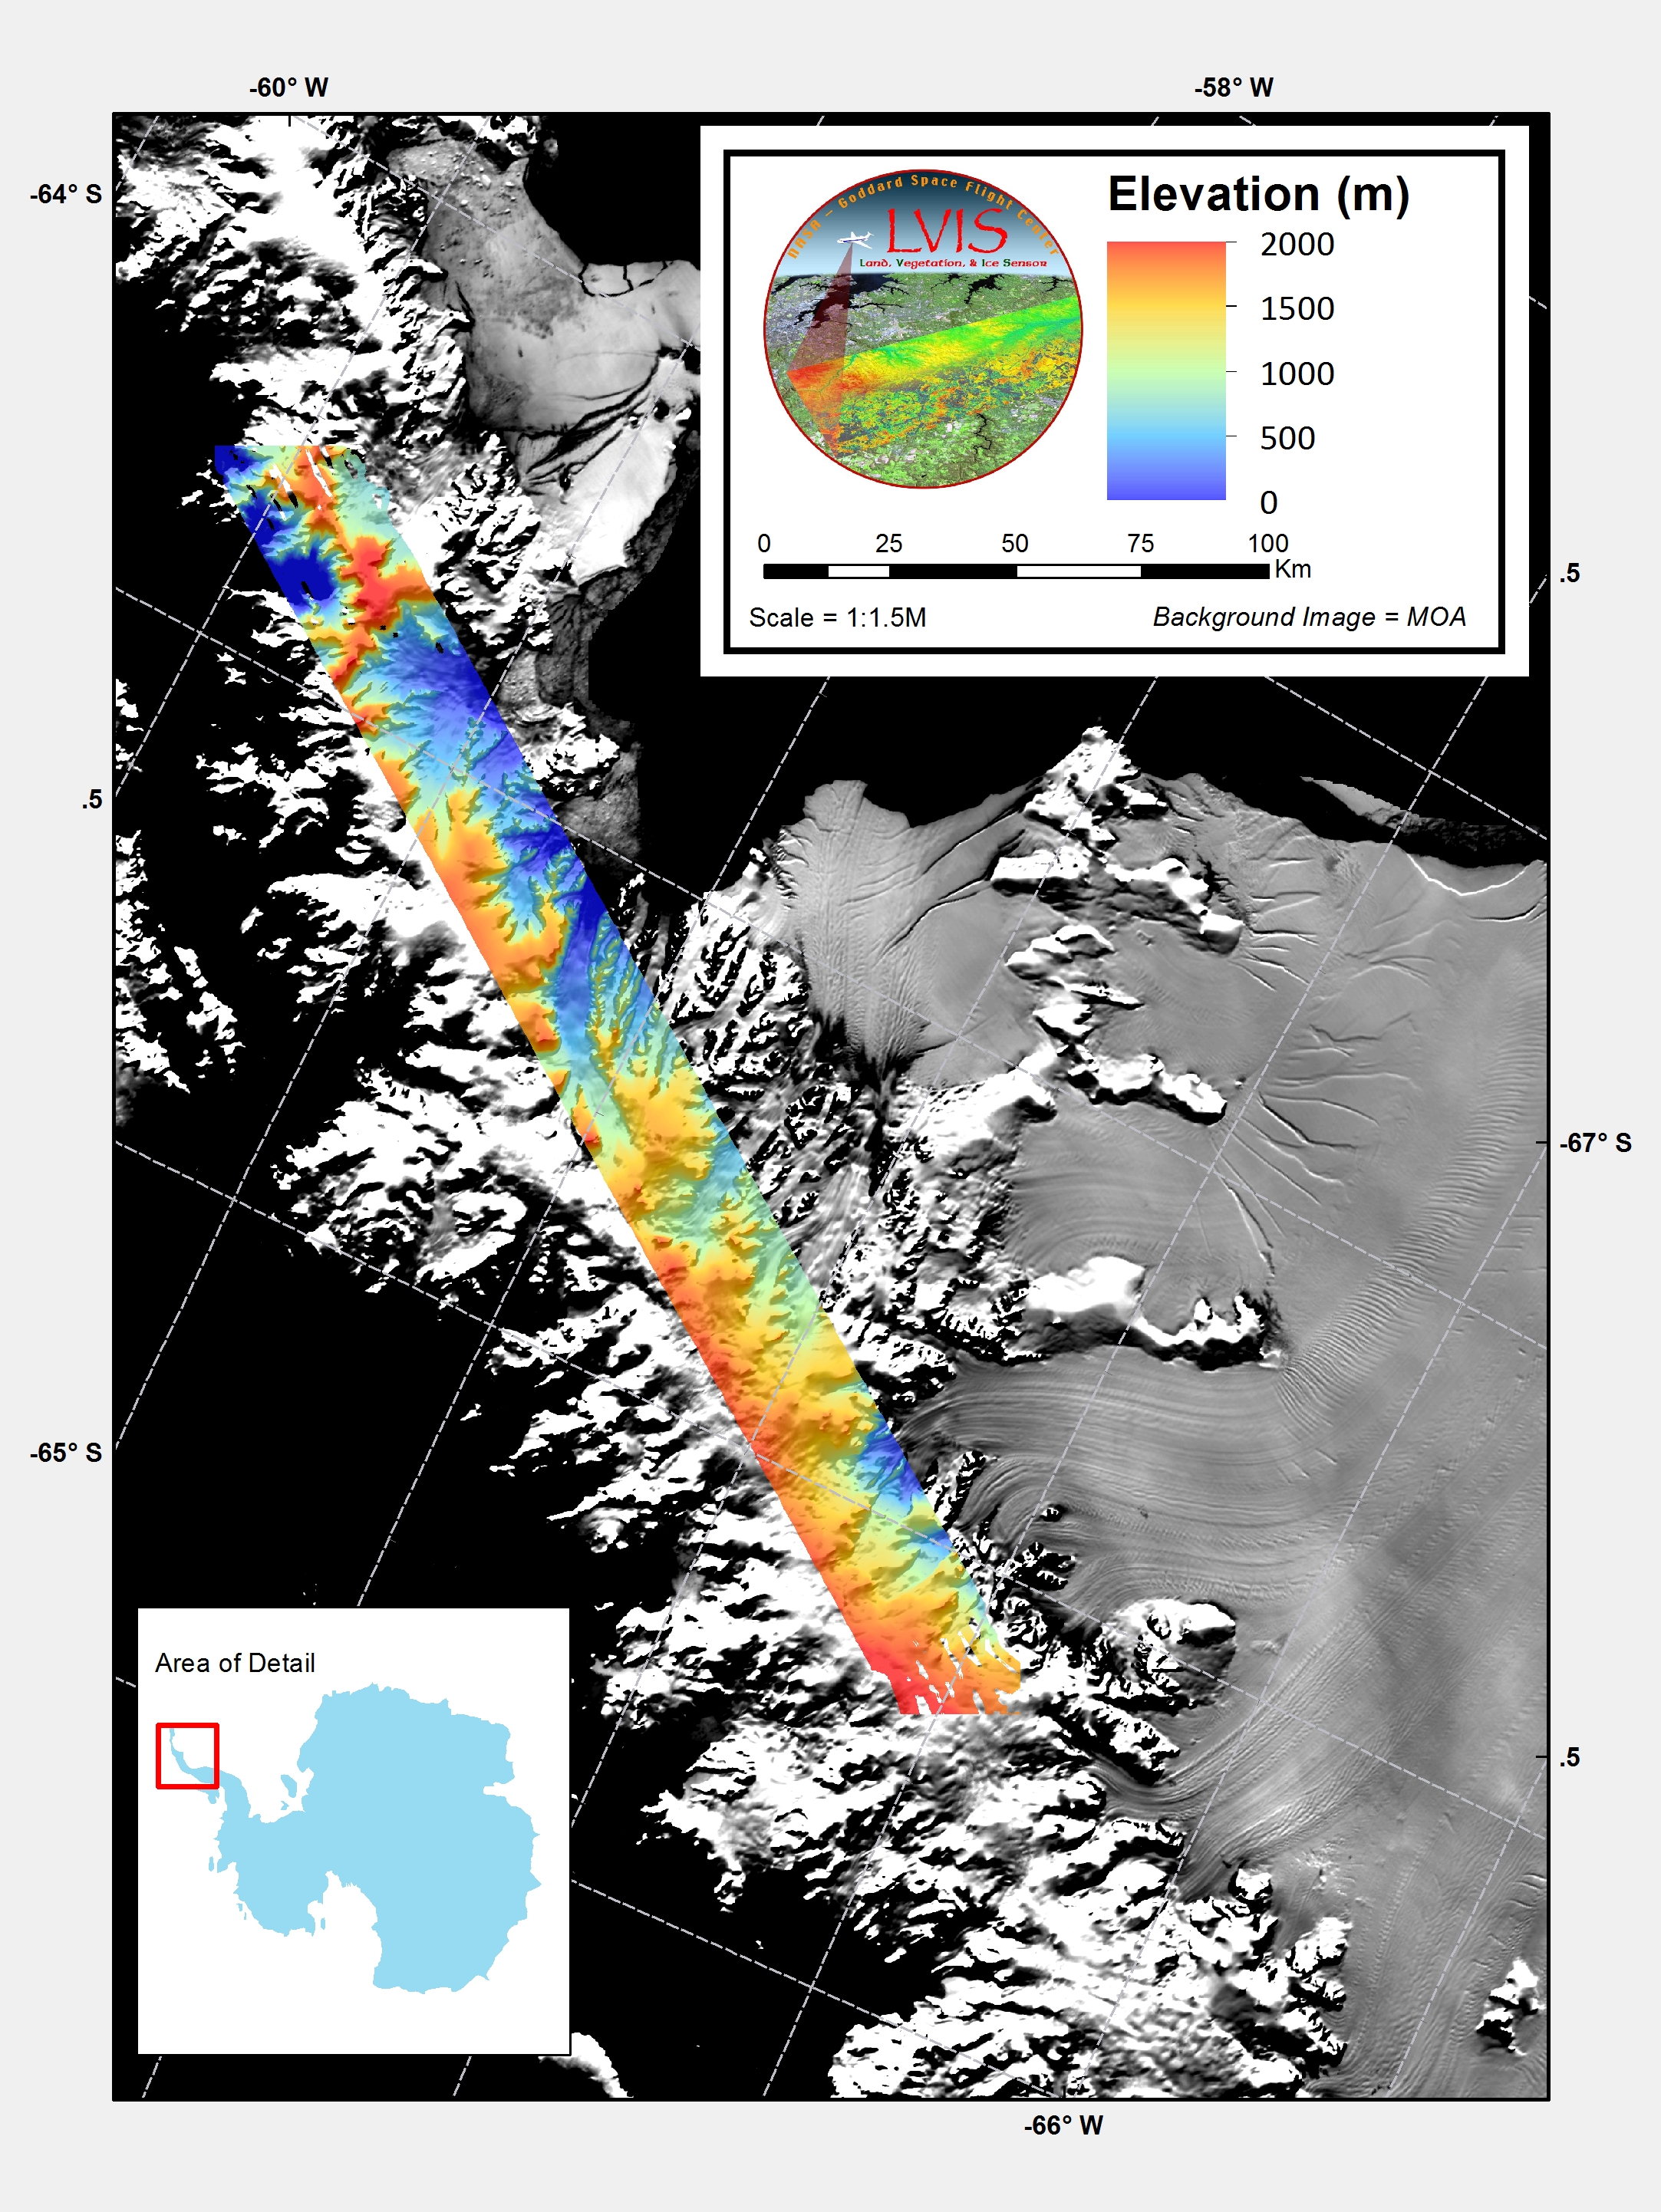 Crane Glacier
An overview slide of the LVIS 2009 data over the Crane Glacier in the Antarctic Peninsula.
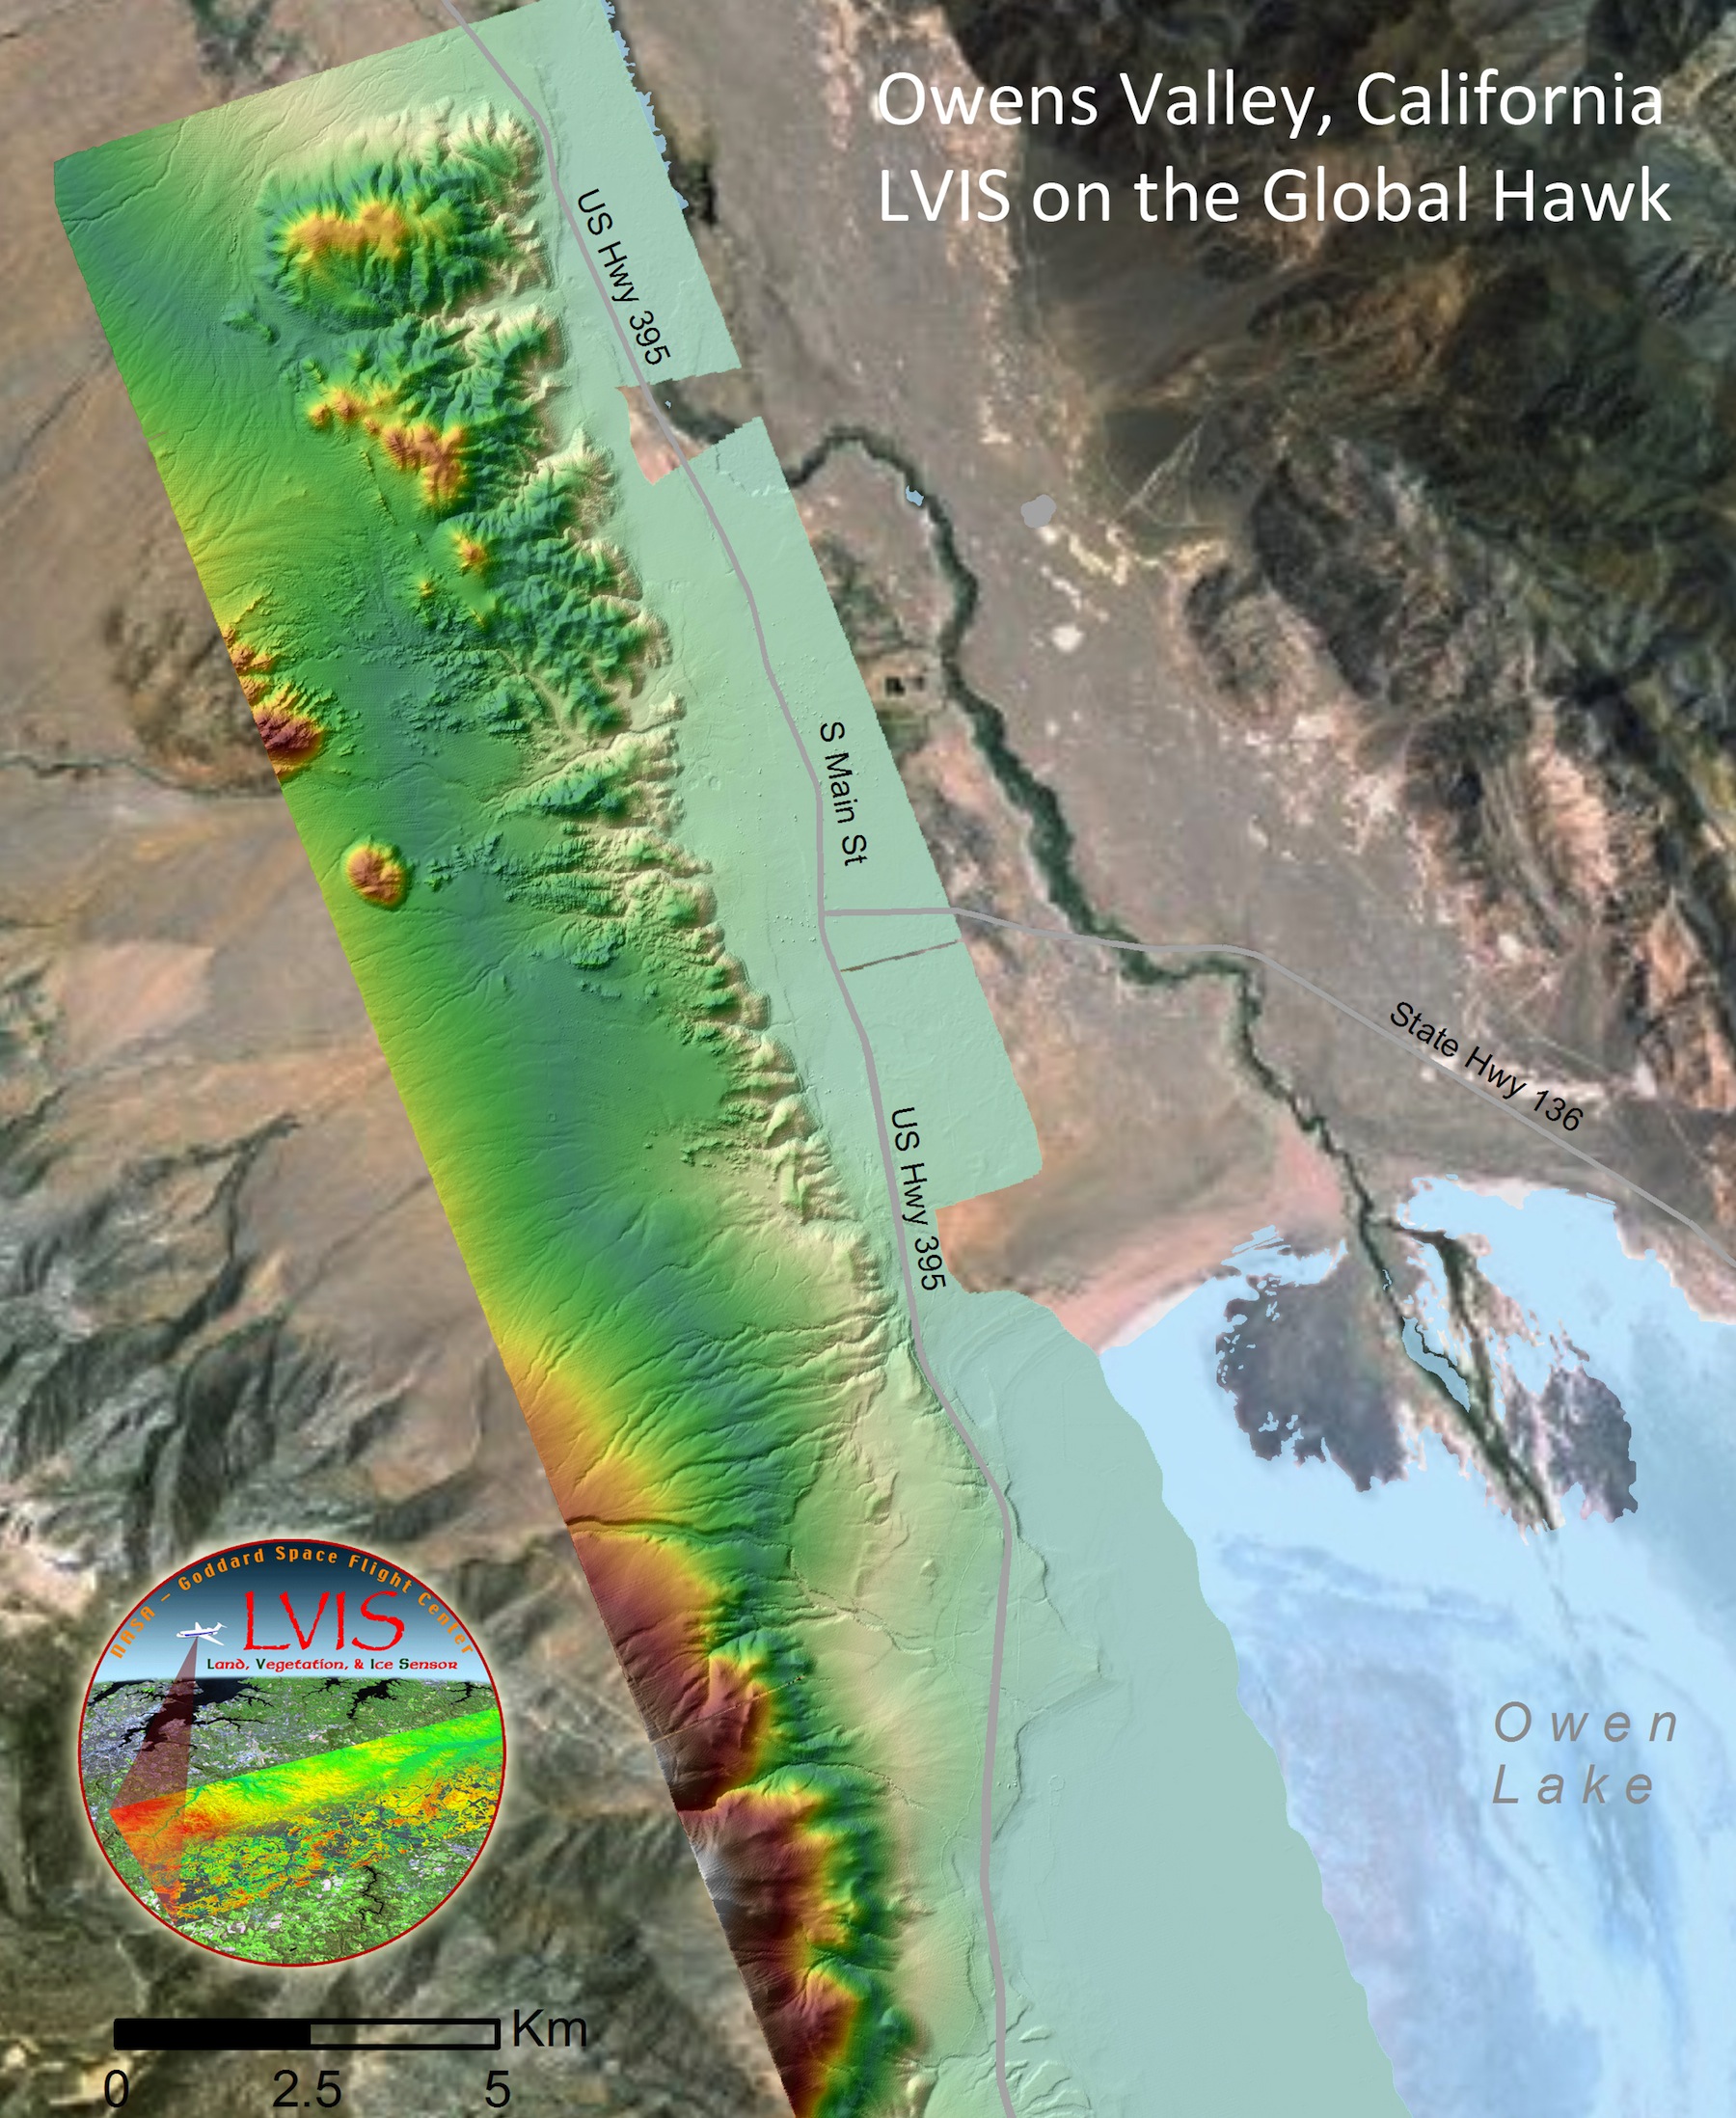 LVIS on the Global Hawk
This is a preliminary plot of a portion of the LVIS Global Hawk dataset in Owens Valley, California. The Global Hawk is an autonomous aircraft that can fly up to 60,000 feet. LVIS was mounted on the platform for a test flight in the summer of 2013. With this capability, LVIS will be able to operate longer and further than ever before - dramatically increasing its mapping abilities.
 Rink Glacier
Composite image showing LVIS data over the Rink Glacier in Greenland. Data is colored by elevation and draped on Landsat imagery. Note how the glacier front and even small icebergs can be discerned. Lower left panel shows the slopes colored by value (red is high slope, blue is low slope).
 Jakobshavn Glacier
Combining LVIS data with other available data informs us of changes in the surface of the ice sheet including retreat of the glacier front of the Jakobshavn glacier.
 Flight
Planning over Pine Island
Glacier (PIG)
Flight
Planning over Pine Island
Glacier (PIG)This is an example of how flight planning can get very complicated, very fast. A GIS is necessary to be able to layer many different datasets, turn some on/off, and ultimately make better decisions. Here is a plot near the Pine Island Glacier (PIG) showing all the flights in the region up to 2015. The ice velocity map is the background, with flight trajectories from previous year's missions, and actual data coverage from some missions. This GIS was used to design flight plans for a mission in Fall of 2015.
 Flight
Planning Poster for Fall 2015
Antarctic Campaign
Flight
Planning Poster for Fall 2015
Antarctic Campaign
This is a flight planning poster we use in the field to be able to see our plan lines all in one place. image size ~14MB
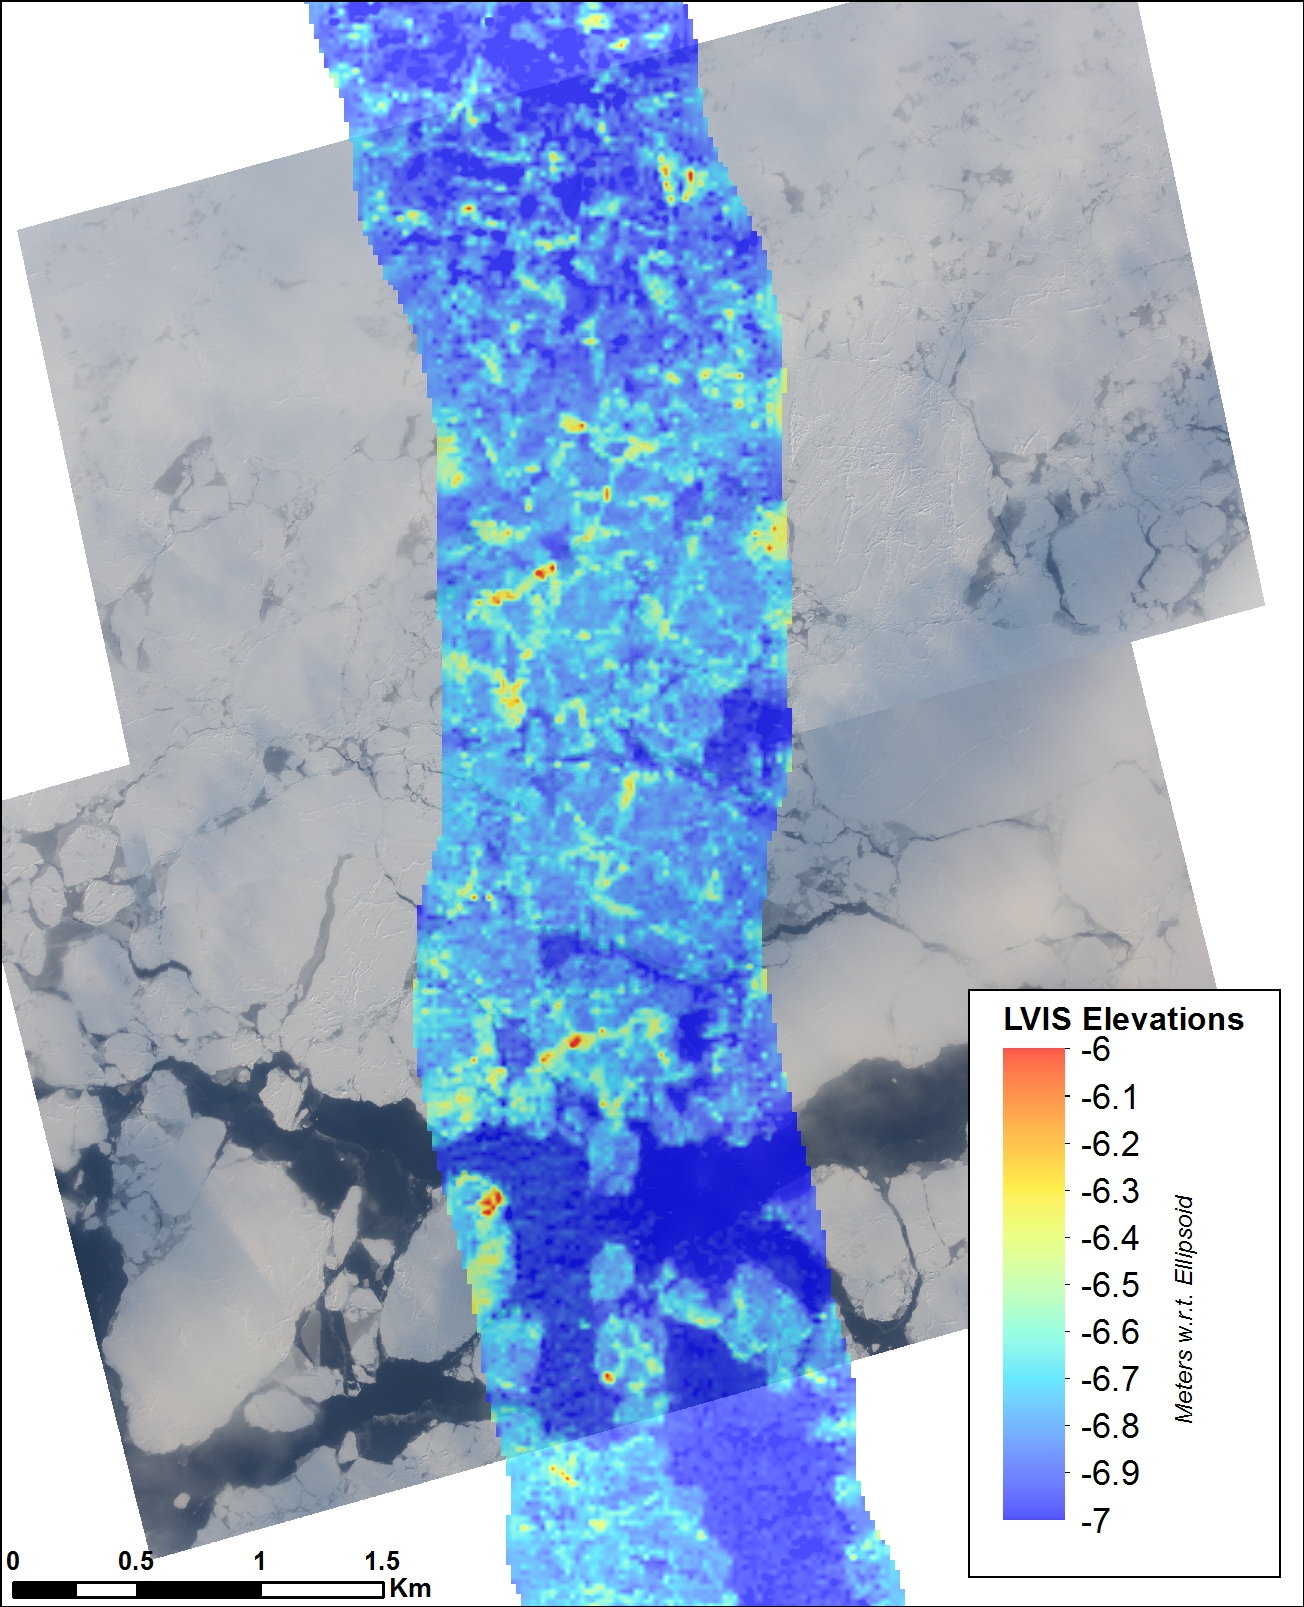 Arctic Sea Ice
This shows LVIS elevation measurements over sea ice in the Arctic. Data is colored by elevation and is plotted ontop of color imagery taken at the same time.
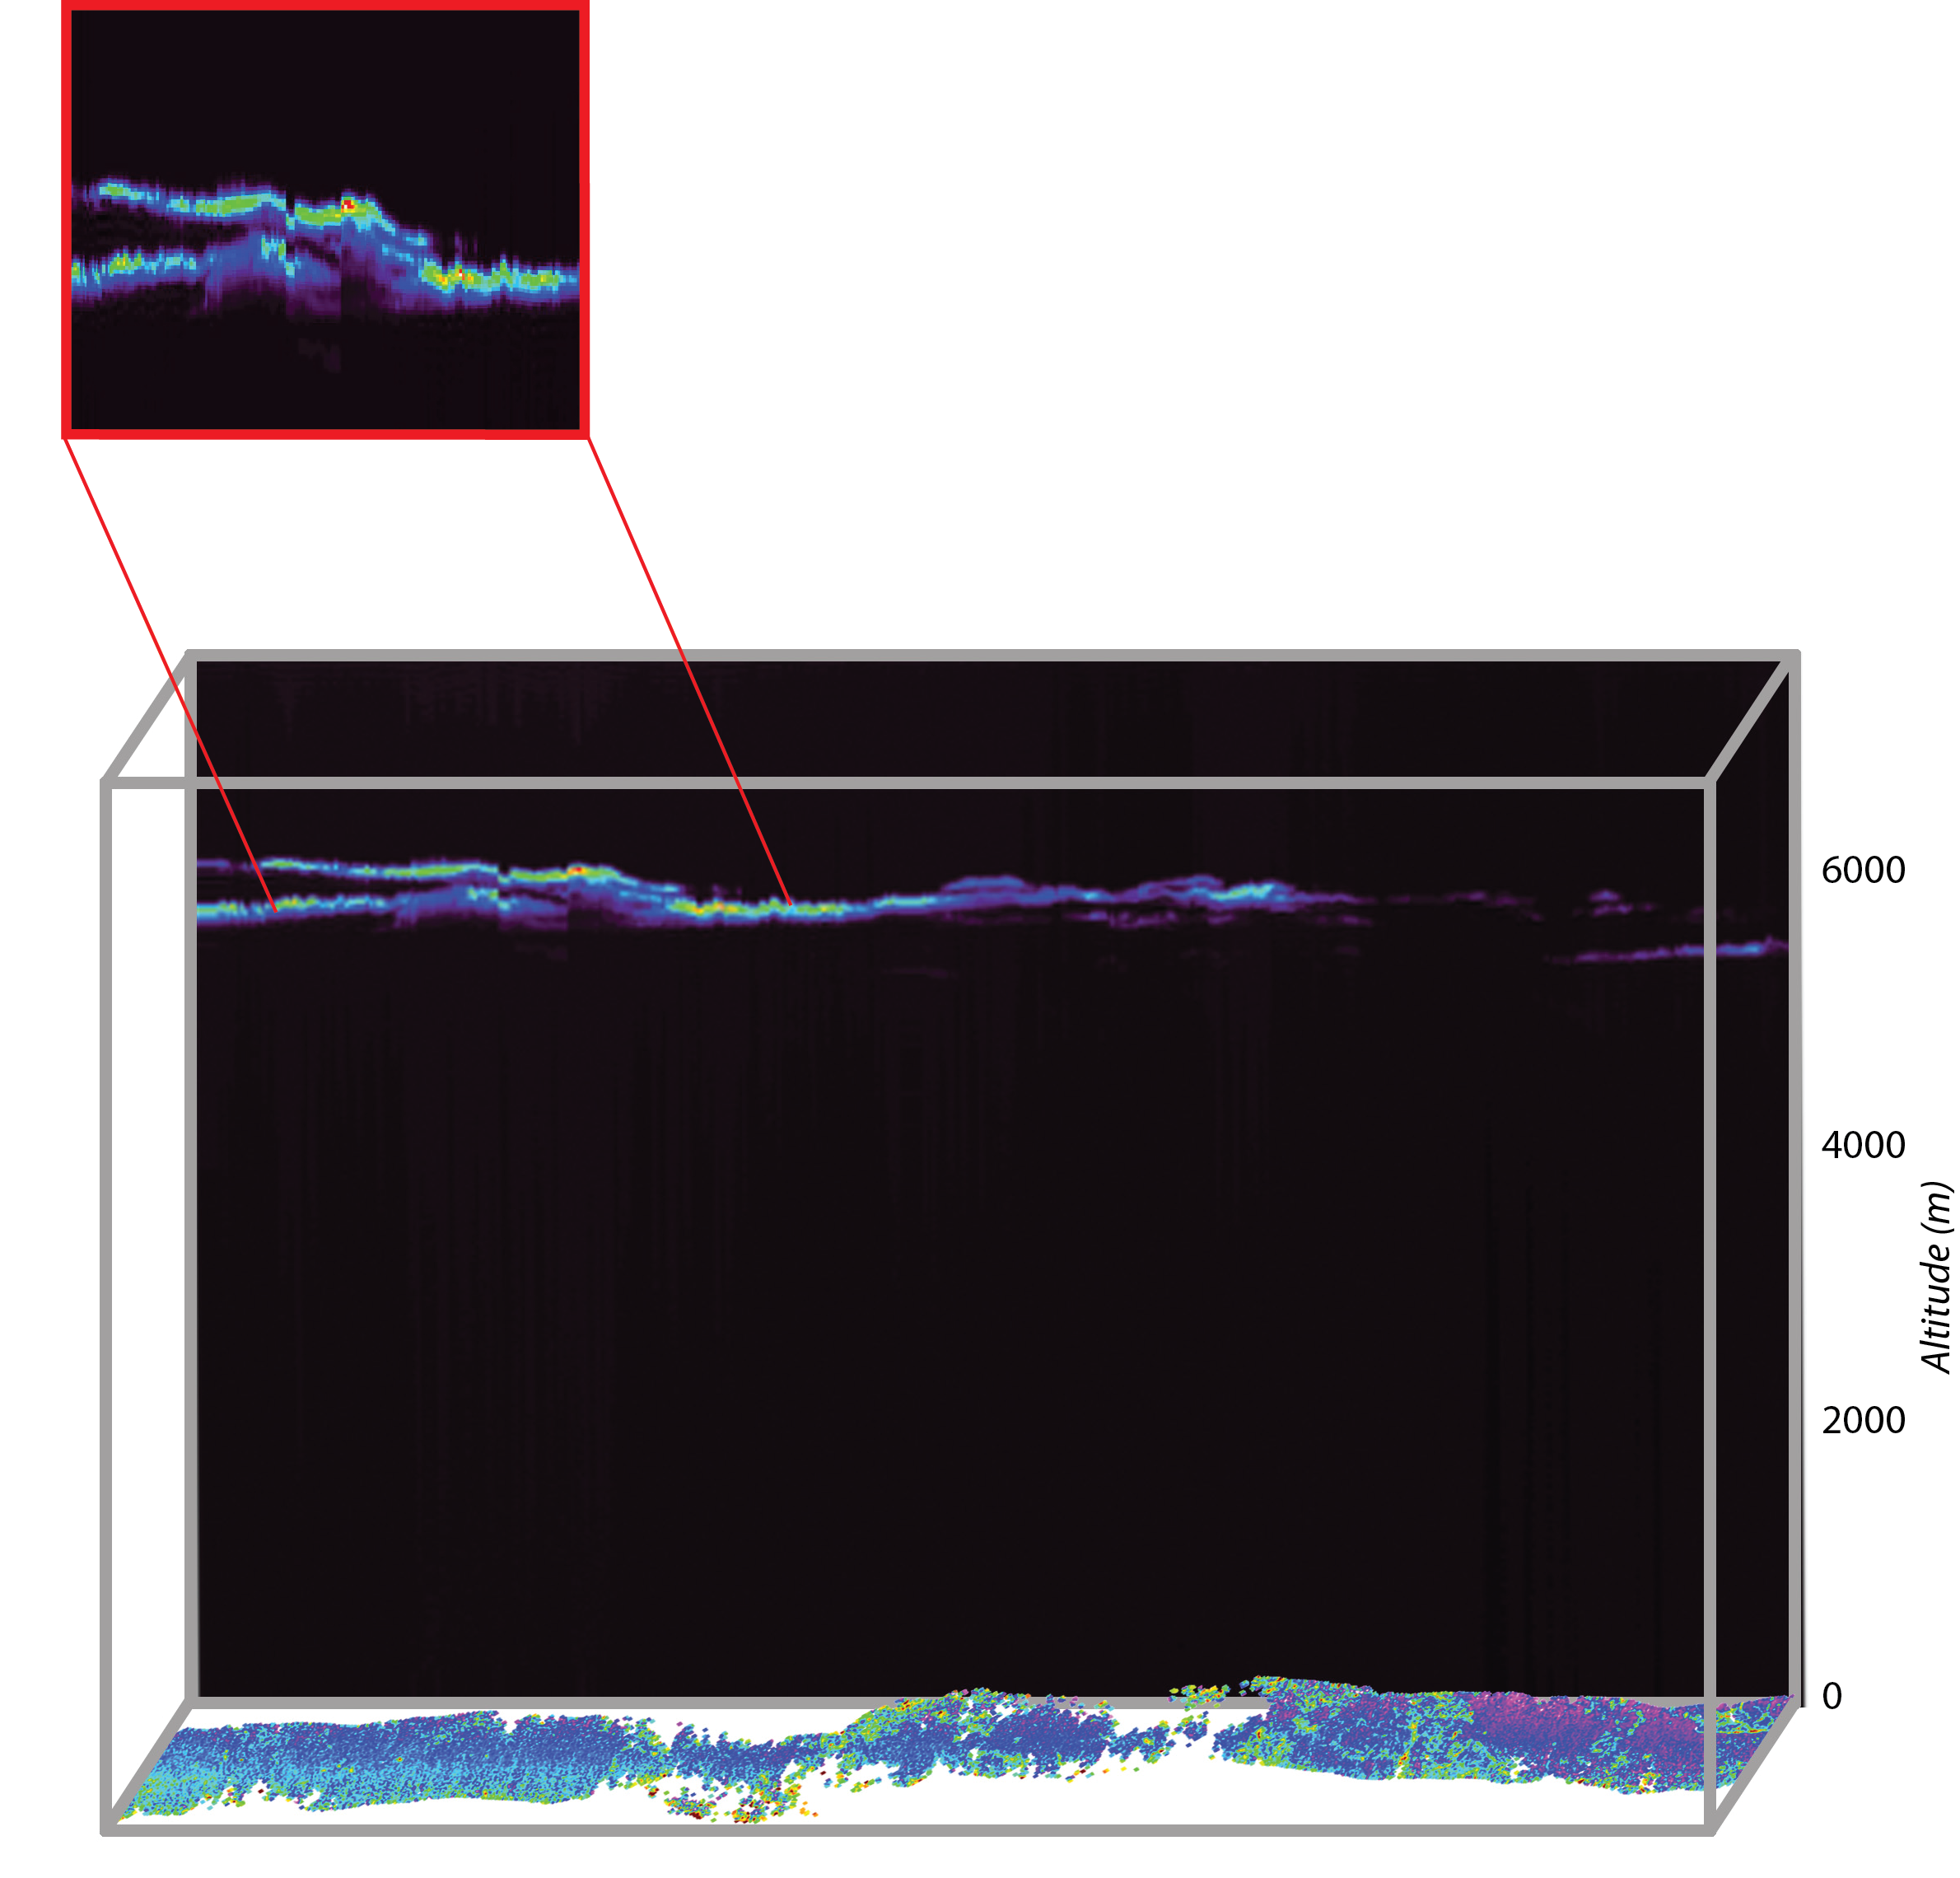 Arctic Sea
Ice with Cloud Measurements
Arctic Sea
Ice with Cloud MeasurementsThis shows LVIS elevation measurements over sea ice in the Arctic with measurements of clouds as well. During the NASA ARISE mission the LVIS instrument tested the capability to measure cloud profiles in addition to its normal surface topography measurements. The bottom portion is the swath over sea-ice colored by elevation where blue is low and red is high. Top portion shows a profile of the clouds over that seaice measurement.
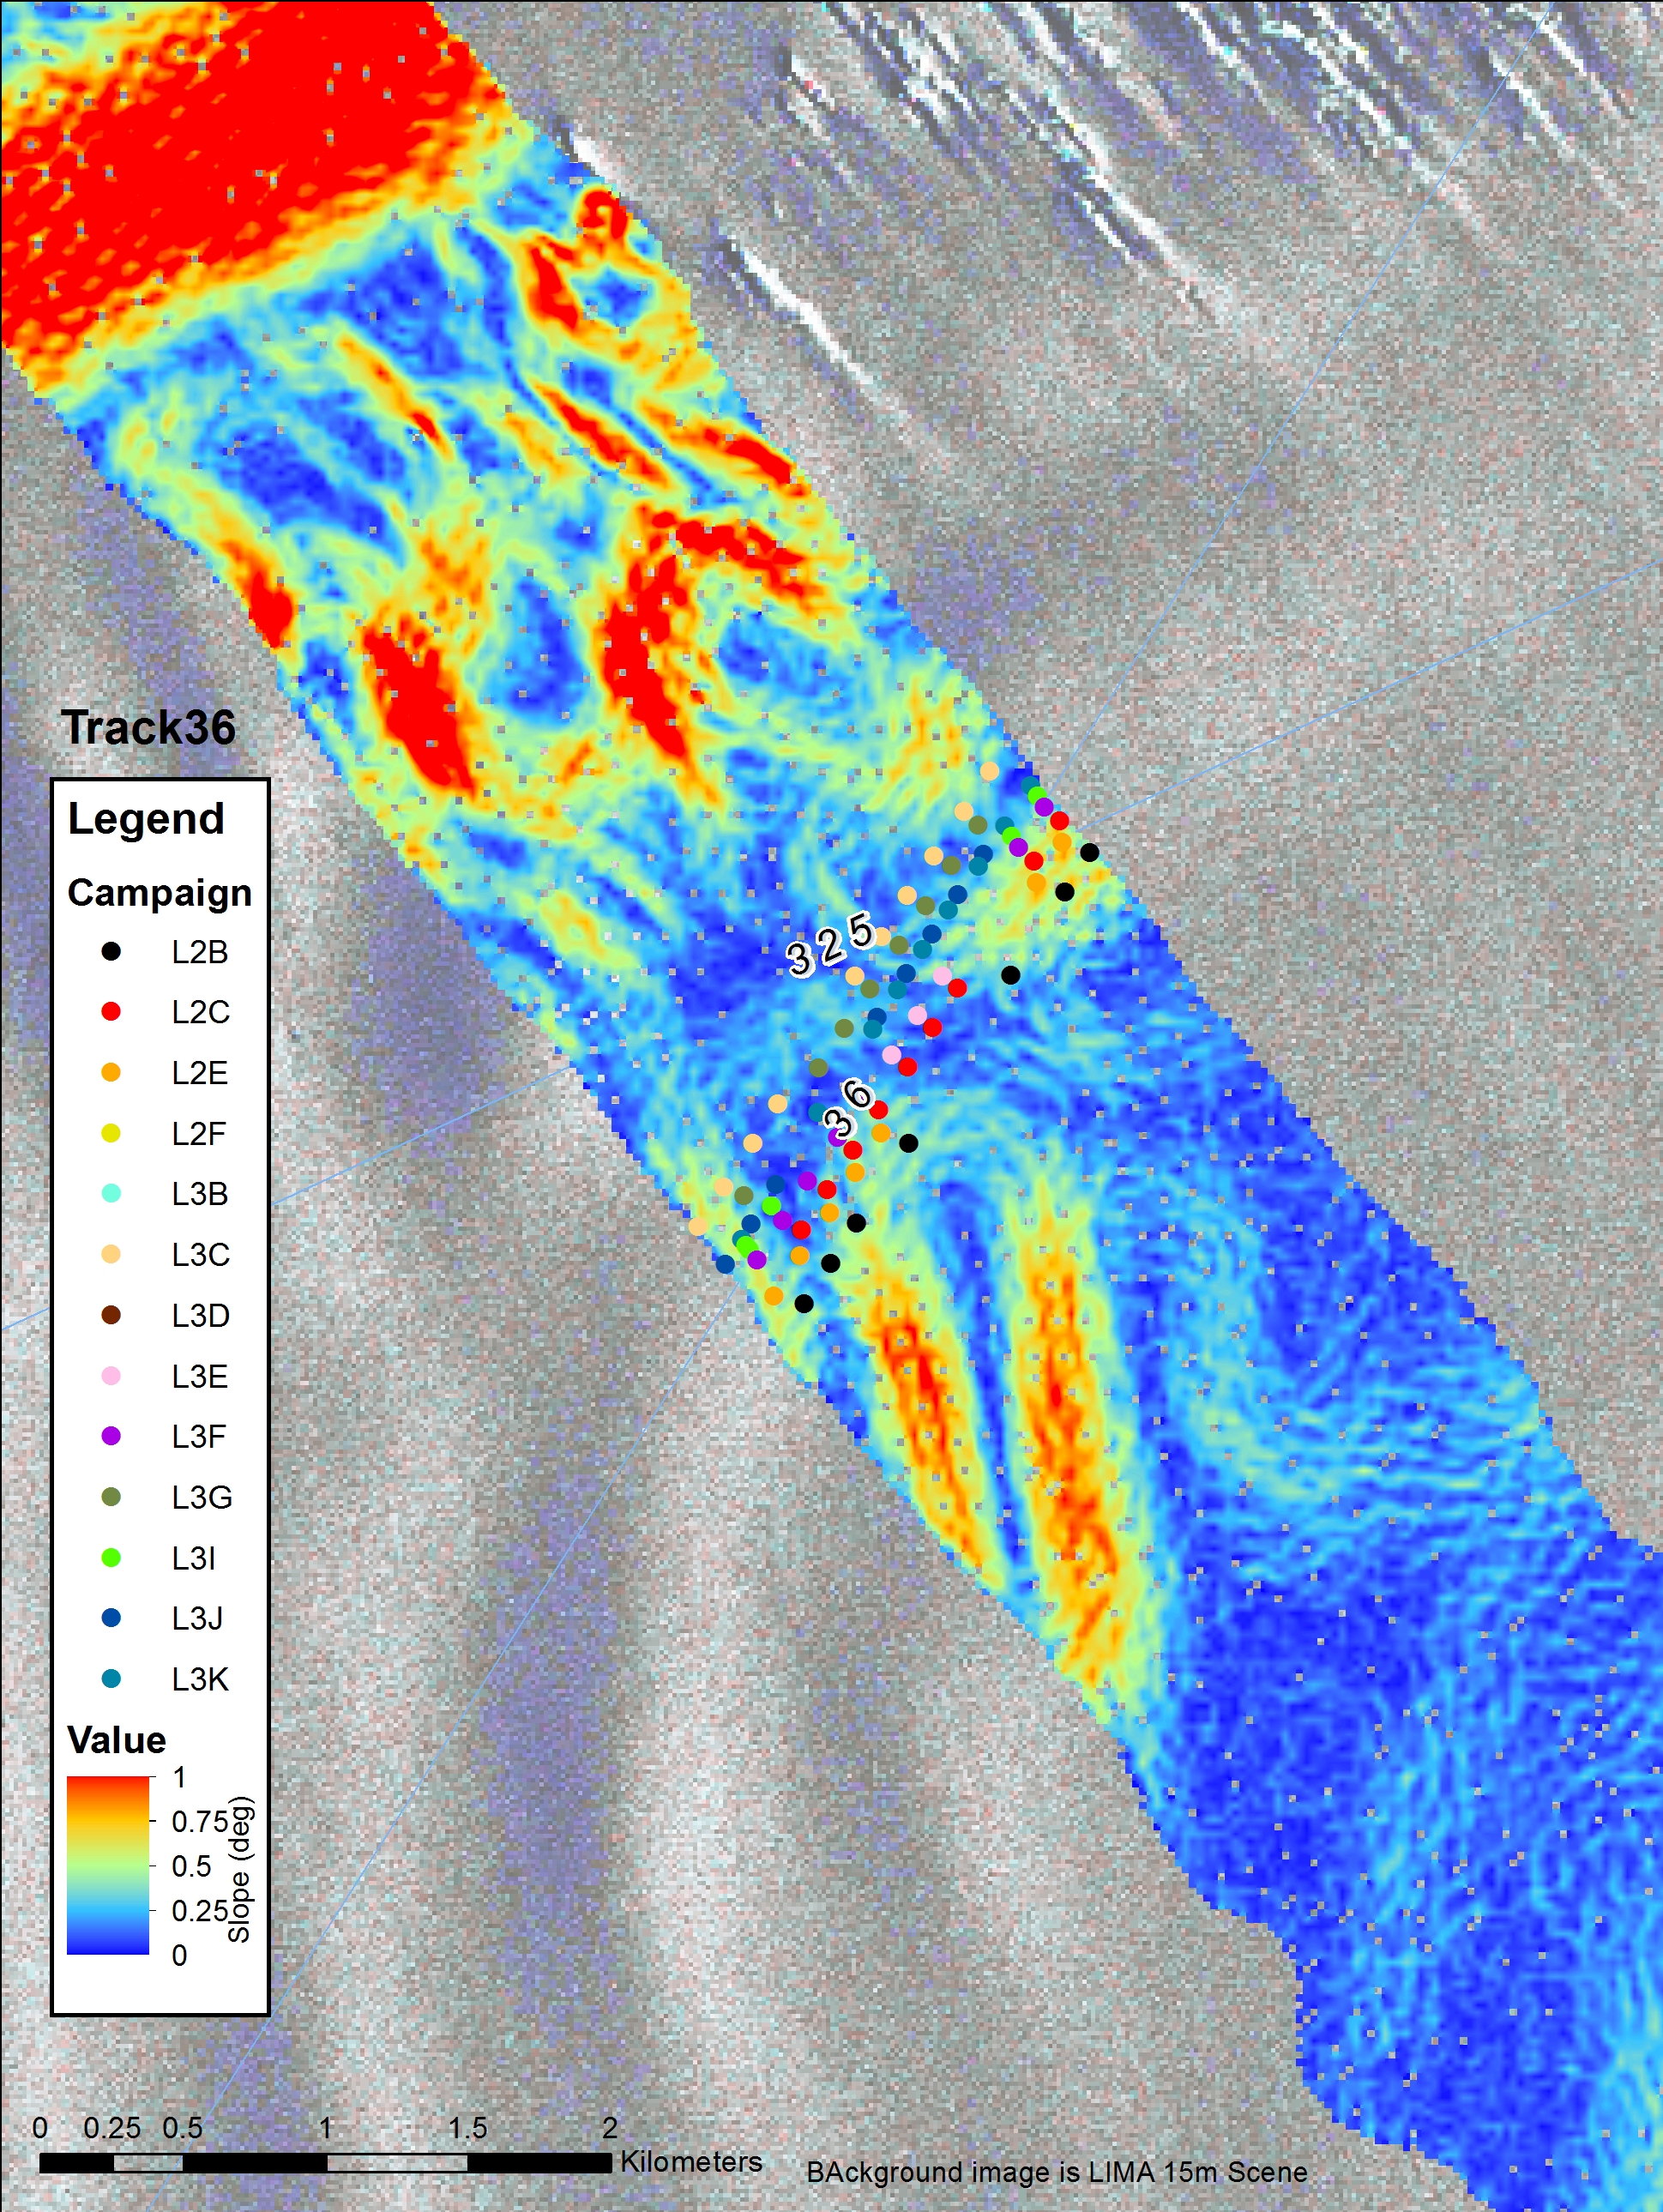 Devicq
Glacier, Antarctica
Devicq
Glacier, AntarcticaThis shows the LVIS swath over the Devicq Glacier in Antarctica. The elevations have been converted to slopes to highlight the dunes in the area, which can also be seen in the underlying imagery from Landsat (credit: LIMA project). Also overplotted are measurements from the ICESat mission. These are represented by dots where each color is a different campaign from the mission.
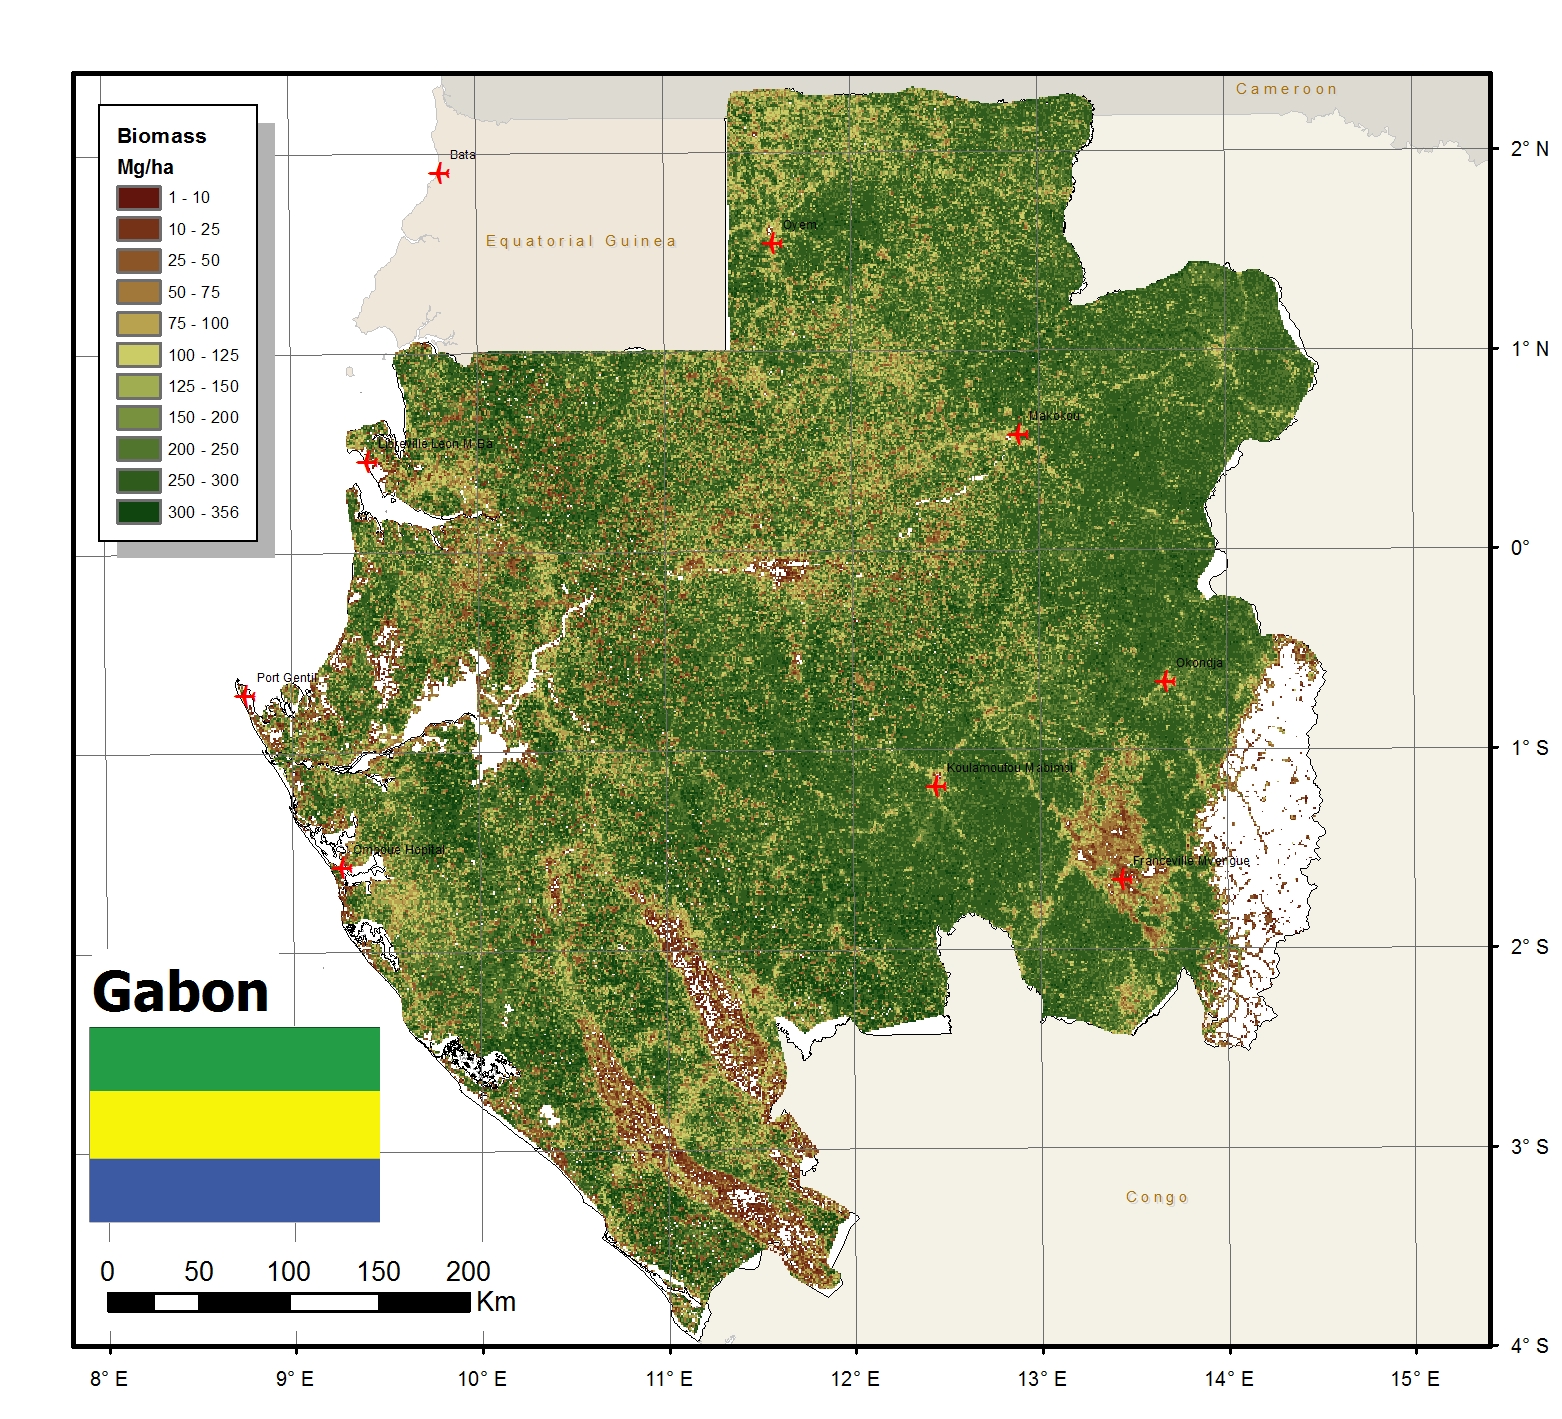 Gabon, Africa
This is a basemap of biomass in Gabon, Africa. LVIS participated in the AfriSAR campaign in February 2016 which helped quantify biomass in this ecologically sensitive region.
 Sverdrup
Glacier, Greenland
Sverdrup
Glacier, GreenlandThis is shows LVIS elevation measurements over the Sverdrup Glacier in Greenland. It is plotted over a Landsat image. comparing the front location from LVIS vs the position from Landsat, you can determine a nominal area of ice loss.
 Owen Valley California
This shows LVIS data that was taken during an experimental flight on the Global Hawk, which is a UAV that NASA is using for scientific research. Warning file is large (~10 MB)
Costa Rican Airport
This movie shows LVIS data from an airport in Costa Rica layered in 3D. The lower dataset is a Hillshade
version of the data. The middle layer is the "ground" elevation, and the top is the "surface" or top elevation.
 Crane Glacier
This movie shows a rotating view of the Crane and Jorum Glaciers in the Antarctic Peninsula. The imagery is from the Digital Mapping System (DMS) and it is draped on the LVIS DEM.
 Narsap & Saqqap Glaciers
This movie shows an overview of the recent Greenland 2012 mission for the Saqqap and Narsap glaciers. These glaciers were close enough in proximity that the plane could fly in a continuous circuit. This accounts for the "racetrack" pattern. The colored portions are where LVIS took data over the glaciers - red indicates higher elevation, blue indicates lower elevations.
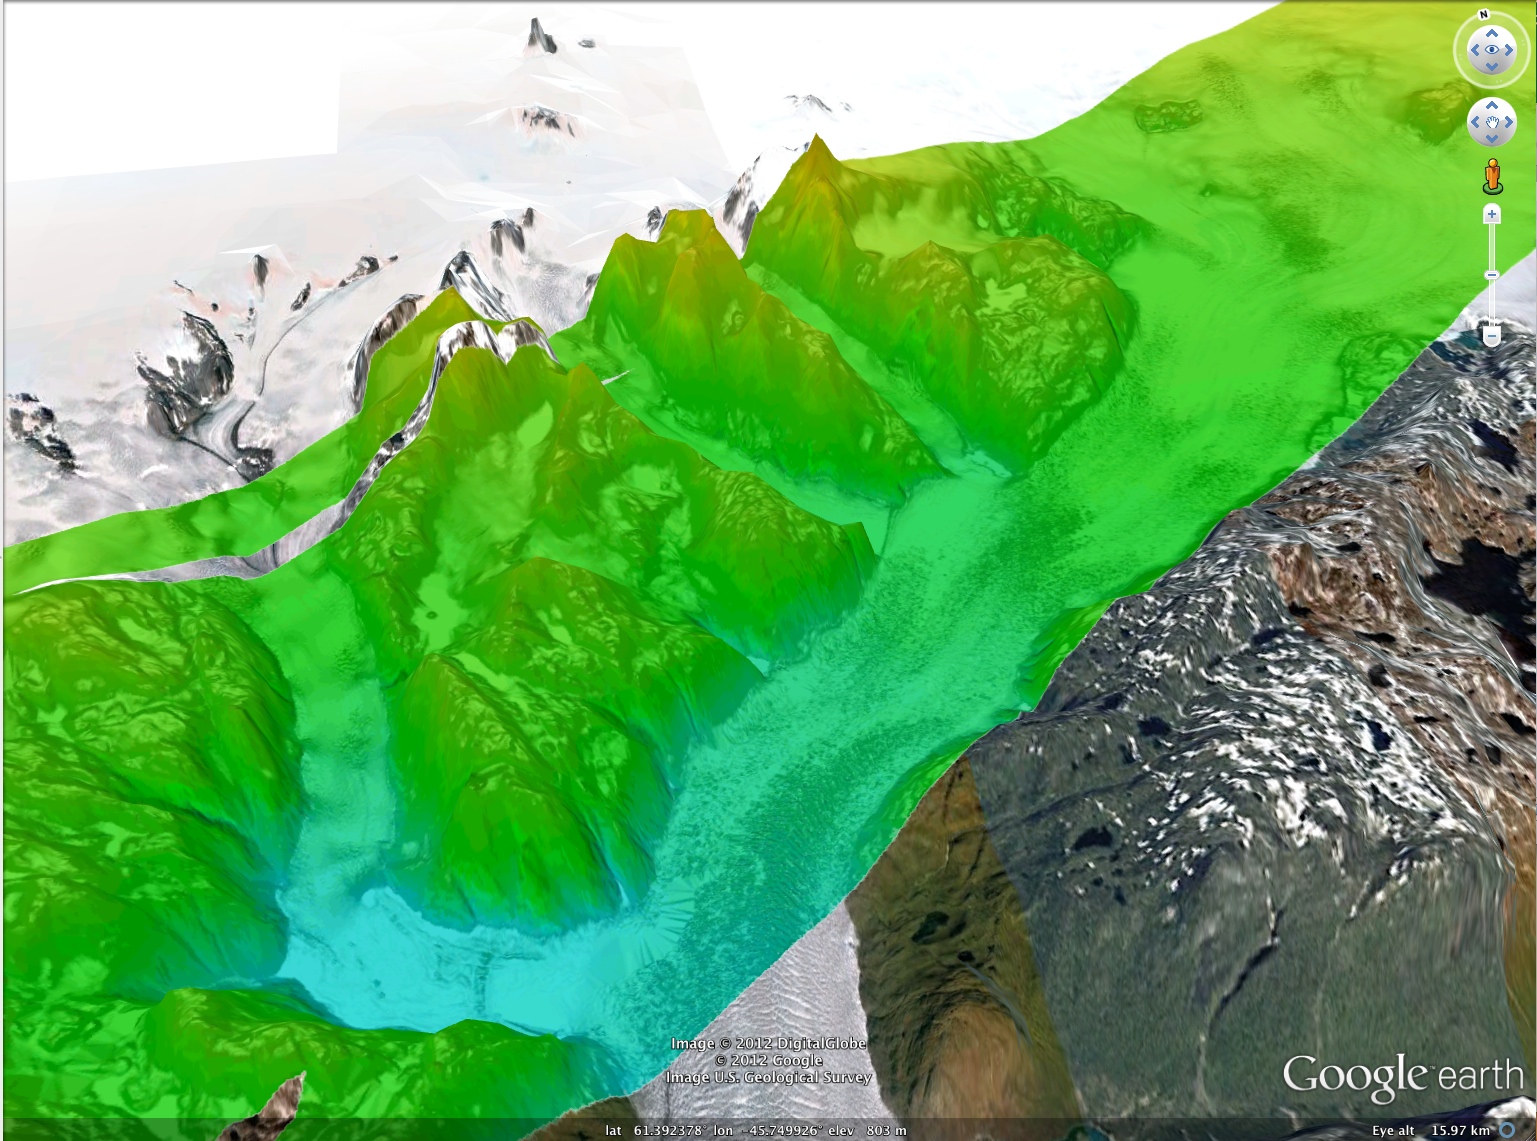 Qajuuttap Glacier
An oblique view of the LVIS elevation and slope data over the Qajuuttap Glacier in Southern Greenland. The colored data is slope data merged with elevation and then draped onto the Google Earth background. Note that the LVIS swath is NOT TRANSPARENT, i.e. the detail you see on the glacier is from the LVIS data, and not the underlying Google imagery.
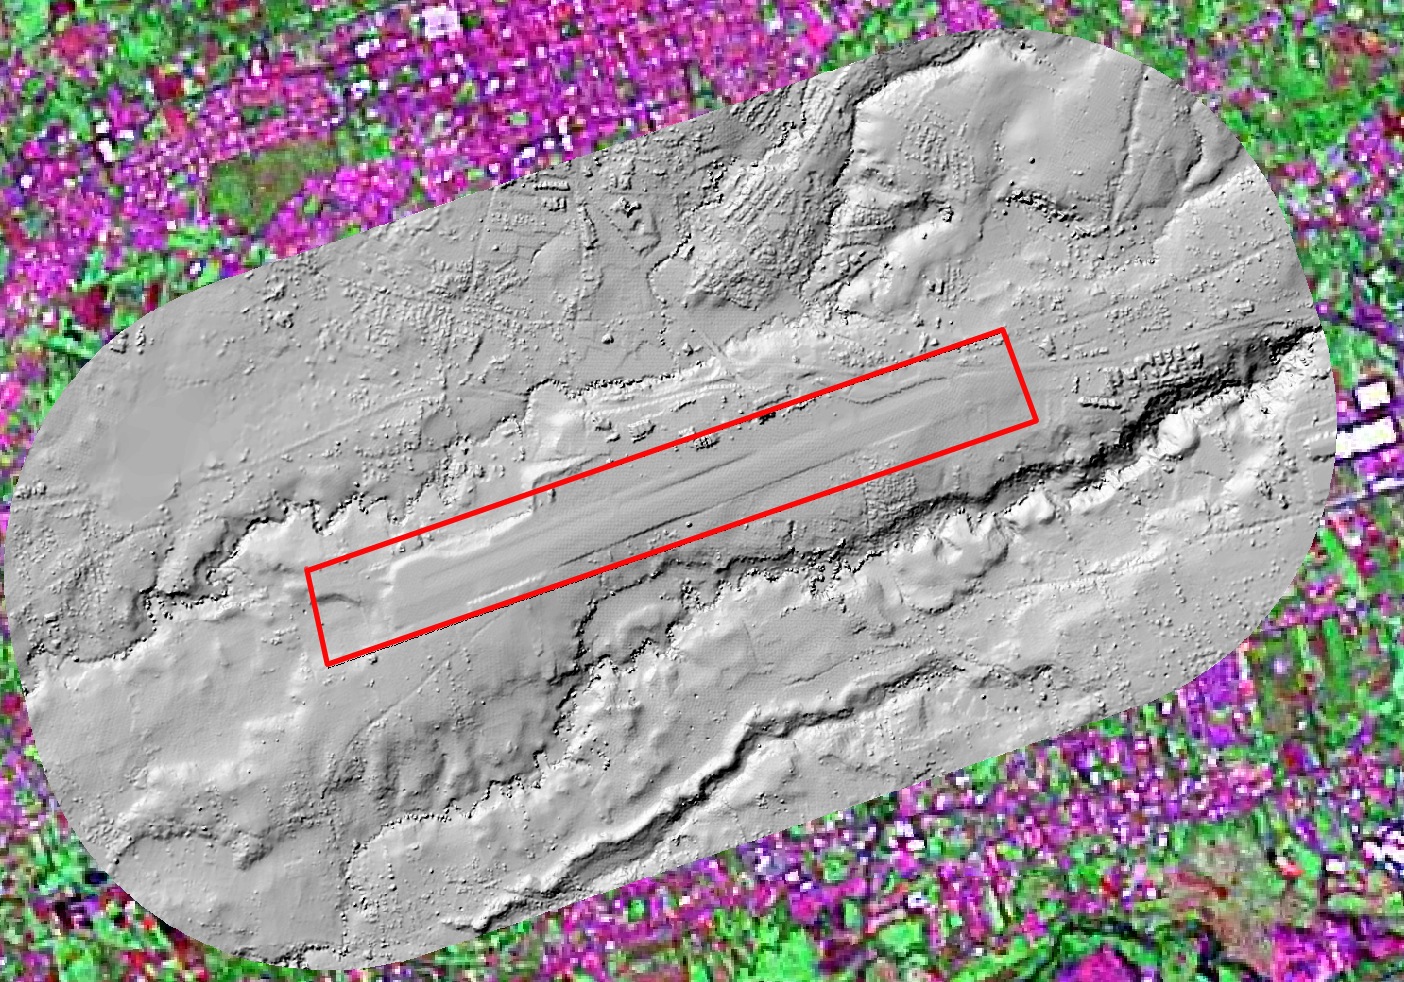 Costa Rica Airport
Grey-scale hillshade image of LVIS data over a Costa Rican airport and town. Airport runway is within the red box.